Cost of Living in the Region Remains Stable Through Pandemic
Between Quarter 2 (Q2) 2019 and Q3 2020, the region and the world have seen unprecedented changes due to the COVID-19 pandemic. However, since CDRPC’s last COLI update, which ran from Q1 2018 through Q2 2019, costs in the Capital Region have remained stable. With the most recent data, this updates is for for the period between Q2 2019 and Q3 2020. The Composite Index, which compiled the other indexes into an overall average, has seen slight increases since Q2 2019. Starting in Q2 2019, the Composite Index was at 107.0 and in the most recent quarter, Q3 2020, the Composite Index is 110.6. Since the pandemic, which began right after Q1 2020, the Composite Index increased from 109.0 to 110.6.
The Composite Index increased steadily after Q2 2019, with increases in both Q3 and Q4 throughout the rest of 2019. Between Q3 and Q4, the Composite Index increased by .6 points, rising from 107.2 to 107.8. The rate of growth increased into Q1 2020, rising by 1.2 points from 107.8 to 109.0. Due to the COVID-19 outbreak, Q2 2020 data was not collected, however, there was a similar increase between Q1 ad Q3 as there was in the previous period. Between Q1 and Q3, the Composite Index increased from 109.0 to 110.6, an increase of 1.6 points.
While the Composite Index did have noted increases, it was not significant enough to be outside of historic trends. Since 2010, the Composite Index has fluctuated between highs of 114 and lows of 105.7. The most recent Composite Index increase is in line with historic index levels from the early 2010s. With some fluctuations, the Composite Index was near similar levels between 2011 Q1 and 2013 Q3. Starting in Q2 2010, the index began to rise through 2011 Q1 where it reached 112.0. The Composite Index hit a 10-year high in 2015 Q2 at 114.0 and then declined through 2017 Q1 where the index hit a 10-year low of 105.7. Since that quarter, the Composite Index has continued to rise overall which has brought the index back to where it was earlier in the last decade.
To check out the COLI data through 2011, adjust the slider on the side of the graph to fit the time period you are interested in looking at.
Since Pandemic, Housing & Utilities Costs Rise, Health Care & Transportation Costs Decline
While all of the measured items had noted increases or declines, none of these changes took the items outside of regular shifts that would note significant change. Of all the Items tracked by the Cost of Living Index, Housing and Transportation have seen the largest increases since Q2 2019. Transportation saw the highest increase, rising from 97.0 in Q2 2019 to 104.5 in Q3 in 2020, an increase of 7.5 points. Since the pandemic began, Transportation costs decreased from 105.3 to 104.5. Housing saw a similar increase, rising from 110.5 in 2019 Q2 to 117.7 in Q3 2020. Since the pandemic began, Housing costs increased from 114.6 to 117.7. There were also increases in Misc. Goods and Services and Utilities. Misc. Goods and Services increased by 3.9 from 105.5 to 109.4. Utilities increased slightly from 103.1 to 103.4 but saw a decline between Q2 2019 and 2020 Q1. After the pandemic began, Utilities increased from 99.3 to 103.4.
Both Grocery Items and Health Care both saw decreases since Q2 2019. Grocery Items saw a decrease from 113.9 to 111.8. This increased slightly after the pandemic, increasing from 110.4 to 111.8. Health Care decreased from 103.2 to 101.2. Health Care costs were on the rise in the region through 2020 Q1 but have seen a decrease since the pandemic.
Comparison To Peer Communities
One of the benefits of using the COLI index is that it makes it possible to compare changes across the country. CDRPC determined peer communities in the 2015 Capital Region Indicators Report. These communities were selected on the criteria that they are within 40% of the Albany-Troy-Schenectady MSA or if they contain a state capital.

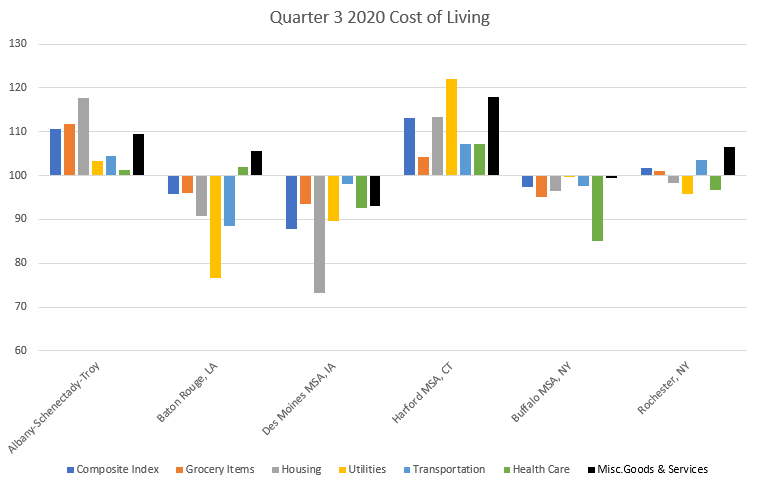
The majority of the selected peer communities across the country saw below the average cost of living across the indexes. Both Albany and Hartford MSA, CT saw all of their indexes above the country average in Q3 2020. Hartford’s Composite Index was the highest of all the peer communities and saw much higher costs in both Utilities, Misc. Goods & Services, and Health Care. Albany saw the highest cost for Grocery Items across the peer communities.
Des Moines MSA, IA and Buffalo, NY both saw all of their indexes below the national averages. Baton Rogue, LA and Rochester, NY saw indexes both below and above the national averages. Baton Rogue had both Health Care and Misc. Goods & Services costs above average, but largely below on Utilities and transportation costs. Overall, Albany, Hartford, and Rochester all saw above the average composite index costs while Baton Rogue, Des Moines, and Buffalo saw below average Composite Indexes.
What is the Cost of Living Index?
Compiled by the Council for Community and Economic Research, the Cost of Living (COLI) Index collects data from cities across the country and tracks changes in the cost of vital goods and services that contribute to an overall cost of living. Data on the cost of Grocery Items, Health Care, Housing, Miscellaneous Goods and Services, Transportation, and Utilities are collected and compiled into separate indexes, and a Composite Index is created which combines these separate indexes and shows the general trend for the cost of living in different cities and metropolitan areas. The data for the Capital Region is collected quarterly by graduate students enrolled in the Department of Geography and Planning at the University at Albany and is funded through a partnership among CDRPC, the Capital Region Chamber of Commerce, and the Center for Economic Growth. The methodology, data requirements, and parameters of the data collected are consistent nationwide to assure comparability among the participating regions.
When data is collected, it is converted to a scale that puts the average cost for each index at 100.


