What is the American Community Survey (ACS)?
The American Community Survey (ACS) differs from the decennial census in that it provides a period estimate rather than a point-in-time estimate. For example, the 2020 Census “long form” sampled the population on April 1st, 2020 and is considered a point-in-time estimate, since the data was acquired in a day. Conversely, ACS data is acquired over a period of time. The two most commonly used ACS estimates are the 1-year estimates and the 5-year estimates. The 1-year estimates are collected over a 12-month period, while the 5-year estimates are collected over a 60-month period. More information on the difference ACS surveys can be found in the table below.
1-year estimates |
1-year supplemental estimates |
3-year estimates* |
5-year estimates |
|---|---|---|---|
| 12 months of collected data Example: 2022 ACS 1-year estimates Date collected between: January 1, 2022 and December 31, 2022 |
12 months of collected data Example: 2022 ACS 1-year supplemental estimates Date collected between: January 1, 2022 and December 31, 2022 |
36 months of collected data Example: 2011-2013 ACS 3-year estimates Date collected between: January 1, 2011 and December 31, 2013 |
60 months of collected data Example: 2018-2022 ACS 5-year estimates Date collected between: January 1, 2018 and December 31, 2022 |
| Data for areas with populations of 65,000+ | Data for areas with populations of 20,000+ | Data for areas with populations of 20,000+ | Data for all areas |
| Smallest sample size | Smallest sample size | Larger sample size than 1-year | Largest sample size |
| Less reliable than 3-year or 5-year | Less reliable than 5-year | More reliable than 1-year; less reliable than 5-year | Most reliable |
| Most current data | Most current data | Less current than 1-year estimates; more current than 5-year | Least current |
| Annually released: 2005-present | Annually released: 2014-present | Annually released: 2007-2013 | Annually released: 2009-present |
Best used when |
Best used when |
Best used when |
Best used when |
| Currency is more important than precision Analyzing large populations | Currency is more important than precision Analyzing smaller populations Examining smaller geographies because the standard 1-year estimates are not available | More precise than 1-year, spans fewer years than 5-year Analyzing smaller populations Examining smaller geographies because the standard 1-year estimates are not available | Precision is more important than currency Analyzing very small populations Examining tracts and other smaller geographies because 1-year estimates are not available |
Source: US Census Bureau
*ACS 3-year estimates have been discontinued. The 2005-2007, 2006-2008, 2007-2009, 2008-2010, 2009-2011, 2010-2012 and 2011-2013 ACS 3-year estimates will remain available to data users, but no new 3-year estimates will be produced. Every community in the nation will continue to receive a detailed statistical portrait of its social, economic, housing and demographic characteristics through 1-year and 5-year ACS products.
Margin of Error
Since the ACS data are estimates and not exact counts of the entire population, the US Census Bureau establishes a margin of error (MOE) for each estimate. The margin of error (MOE) can be used to create ranges for all ACS estimates and are at the 90% confidence level.
ACS Helpful Hints
- When discussing the multi-year period estimates, the best way to characterize the data is to state that the data cover a period of years, rather than use the year of release. For example, for a 5-year estimate, released in 2022 the data might be characterized as, “The poverty rate in this community over the period 2018-2022 was X percent”.
- If comparisons are to be made between various communities, care should be taken to ensure that the same period estimates are used; 1-year data should only be compared with other 1-year data; 3-year data compared only with other 3-year data and 5-year data with other 5-year data. With the 3- and 5-year multi-year estimates, time series comparisons should only be done with non-overlapping data; for example the 5-year estimate for 2012-17 can be compared to the 2018-22 5-year estimates.
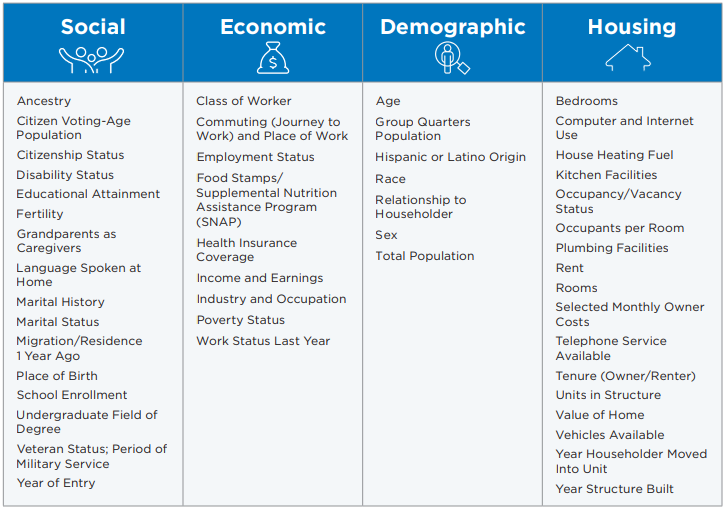
Explore ACS Topics

Source: U.S. Census Bureau