Cost of Living in the Region Declines Overall
Since CDRPC’s last COLI update in Quarter 3 (Q3) 2020, the Cost of Living in the region overall has decreased and has decreased for several major categories. With updated data ranging from Q4 2020 through Q3 2021, costs overall have been decreasing as we continue to recover from the pandemic. The Composite Index, which serves as an aggregate of all the categories measures in the COLI Index, had declined in each quarter following Q3 2020 where it reached a peak of 110.6. The Composite Index declined to 106.3 in the most recent quarter, Q3 2021.
Housing, Transportation, and Utility Costs in the Region Decrease
Housing, Transportation, and Utilities have all decreased since Q3 2020. Housing saw a brief increase after Q3 2020 when it reached a peak of 118.2 in Q4 2020. After this quarter costs dropped sharply, declining all the way 110.3 in Q1 2021. After another quarter of slight increase, Housing costs reached 105.3 in Q3 2021. Transportation saw a similar drop, beginning it’s decline after Q3 2020 from 104.5 down to 97.1 a year later in Q3 2021. Like Transportation, Utilities saw a significant drop after Q3 2020. Utilities dropped from 103.4 in Q3 2020 to 96 in Q1 2021. After Q1 2021, Utility costs increased, but not to the previous levels. In Q3 2021, Utilities reached 98.9.
Grocery Items have also technically declined from Q3 2020. In Q3 2020, Grocery Items were at 111.8. After this quarter, the price jumped up to 114.5 in Q4 2020 and 114.8 in Q2 2021. However, costs dropped to 110.2 in Q3 in Q3 2021, lower than a year ago after being high the previous quarters of 2021.
Health Care and Miscellaneous Goods and Services Costs Increase
Both Health Care and Miscellaneous Goods and Services saw increases since Q3 2020. Health Care costs started at 101.2 in Q3 2020 but have since increased to 105.8 in Q 2021. This is the third highest Health Care costs have reached since 2017. Miscellaneous Goods and Services has seen fluctuation since Q3 2020, increasing to 110.1 in Q1 2021. This was followed by a decline to 108.2 in the following quarter, and then an increase back up 110 in Q3 2021.
What is the Cost of Living Index?
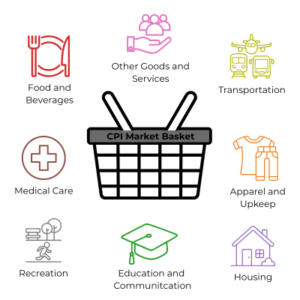
Compiled by the Council for Community and Economic Research, the Cost of Living (COLI) Index collects data from cities across the country and tracks changes in the cost of vital goods and services that contribute to an overall cost of living. Data on the cost of Grocery Items, Health Care, Housing, Miscellaneous Goods and Services, Transportation, and Utilities are collected and compiled into separate indexes, and a Composite Index is created which combines these separate indexes and shows the general trend for the cost of living in different cities and metropolitan areas. The data for the Capital Region is collected quarterly by graduate students enrolled in the Department of Geography and Planning at the University at Albany and is funded through a partnership among CDRPC, the Capital Region Chamber of Commerce, and the Center for Economic Growth. The methodology, data requirements, and parameters of the data collected are consistent nationwide to assure comparability among the participating regions.
When data is collected, it is converted to a scale that puts the average cost for each index at 100.


