Capital District Data-Growth Patterns & New Residential Construction
The Summer 2017 issue of Capital District Data is now available from the Capital District Regional Planning Commission. This issue explores the related topics of Patterns of Growth, and New Residential Construction.
Patterns of Growth
A review of the patterns of growth across the Region reveals an interesting result. Population growth across the region has slowed dramatically from where it was from 2000 to 2010. From 2000 to 2010, the Region’s population grew by 5.5%, but from 2010 to 2016 the population grew by only 1.5%. Growth from 2015 to 2016 was an anemic 0.13%. Growth in the population centered mostly around the municipalities along I-87 (Colonie, Halfmoon, Malta, and Saratoga Springs). Outside of these municipalities population change was mostly flat. Of the 79 municipalities, almost half saw their populations change somewhere between -.09% and +0.9%. In other words, almost half of the communities saw very little change in their population from 2010 to 2016.
From 1995 to 2015, construction of single-family units alone accounted for 56,000 acres of land, or 87.5 square miles. The land used to develop all of these new single-family homes is larger than the entire town of Duanesburg (72 square miles). Over that same time period, the population of the Region increased by roughly 55,000. This means that, over the course of 20 years, for every new person added to the Region, roughly an acre of land was developed for single-family homes.
With the rate of population growth declining, it is possible that the imbalance between it and land consumption will continue to grow. While housing construction was slowed by the Great Recession, it is now recovering; meanwhile, the rate of population growth continues to decline. As construction continues to build outward into new land, it is further diffusing the population. This pattern of growth could prove to be unsustainable.
New Residential Construction
The Region continues to see a shift in residential construction. Overall, permits for residential homes continue to increase since bottoming out in 2009 & 2010. While permits were down from 2015, building activity is slowly approaching pre-recession levels.
The major story continues to be the emergence of multi-family units. Before the recession, permits for single-family units dominated. But in recent years, the share of permits for multi-family units has grown. In 1993, 14% of all permits were for multi-family housing and increased to 20% by 2004. Recently, the share has grown to rival that of single-family units. In 2011, permits for multi-family units hit 50% for the first time. In 2015 & 2016, permits for multi-family units exceeded 50% of the Region’s total permits for the first time in consecutive years.
Permits for single-family units did increase in 2016 though they lag behind both in terms of share, and total number. In raw numbers, permits for single-family units exceeded 1,300 for their highest total since 2007. Since bottoming out with just 865 permits in 2011, single-family permits have made a slow recovery.
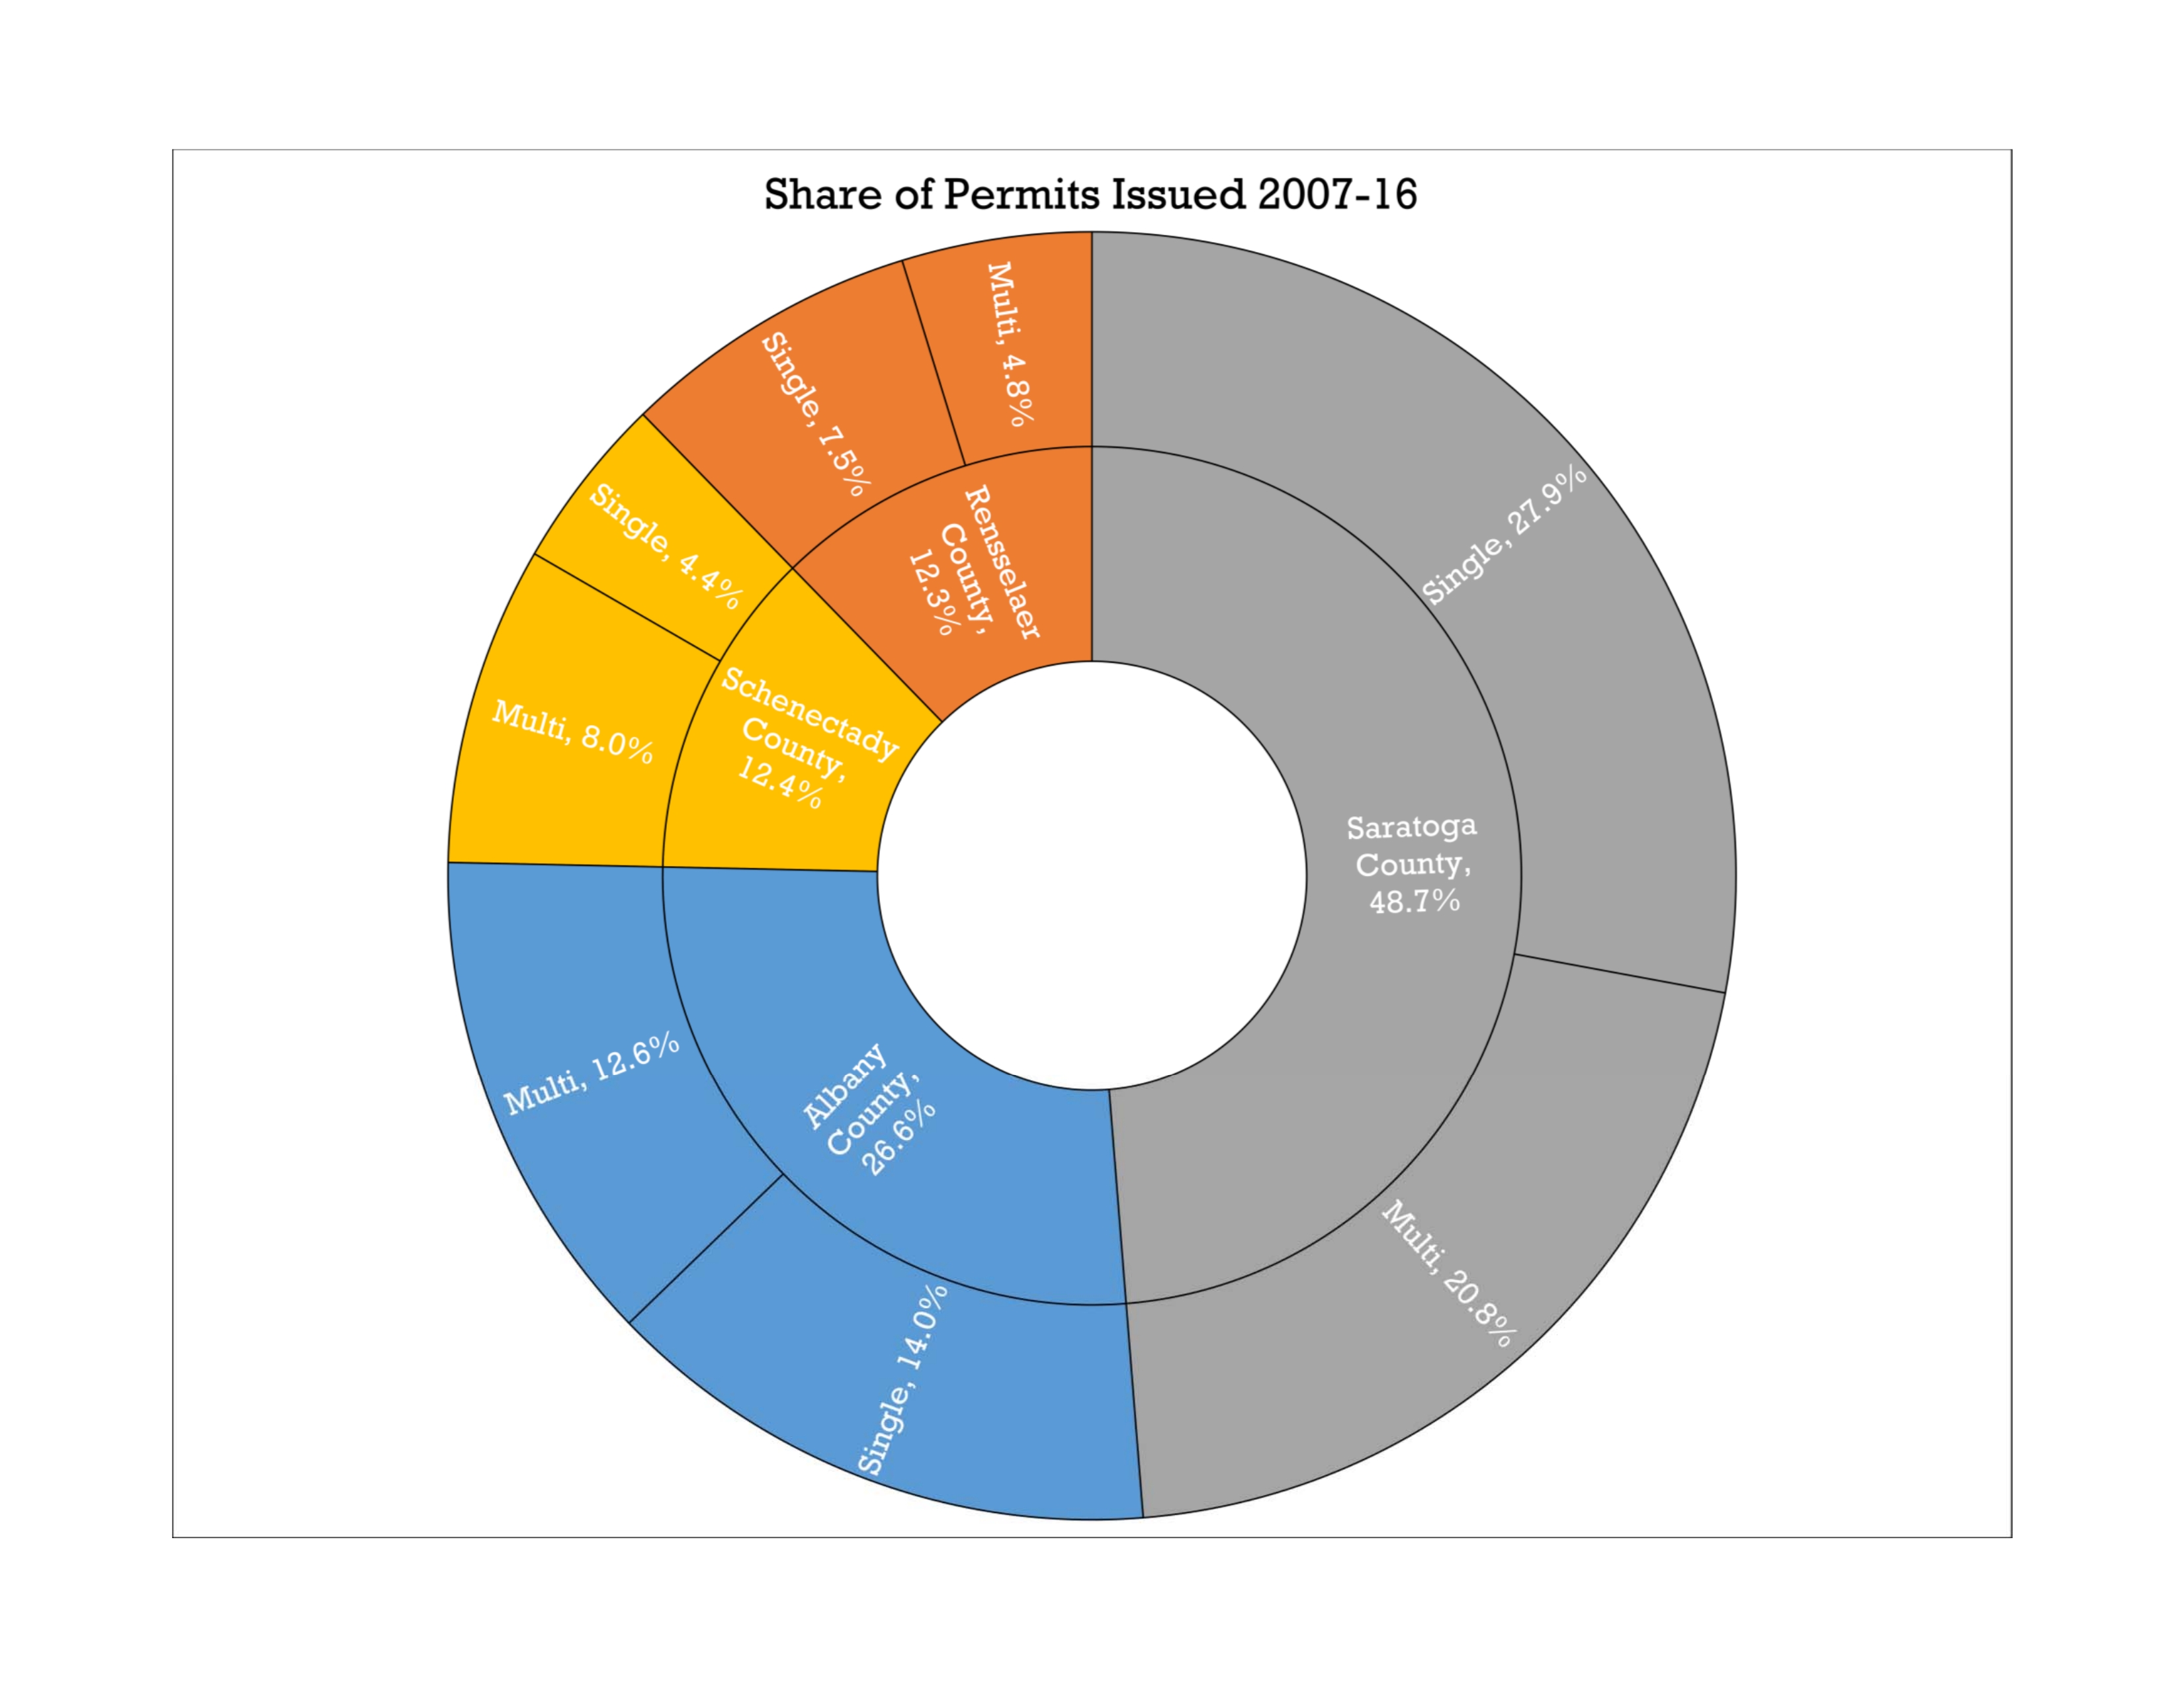
A ten-year overview of permits shows some interesting trends. Unsurprisingly, Saratoga County accounts for almost 49% of all permits, and a majority of those were for single-family units. Locally, Halfmoon is the dominant municipality for new permits, accounting for almost 12% of all new single-family permits from 2007 to 2016. Permits for single-family units were heavily concentrated while those for multi-family units were more evenly distributed. Halfmoon and Colonie were ranked #1 and #2 for single-family permits, but Clifton Park was a distant #3. Permits for multi-family units weren’t as numerous as those for single-family units, but they didn’t drop off as quickly. From #1 Saratoga Springs to #10 Moreau there was a 53% drop, while permits for single-family permits saw a 78% drop off from #1 Halfmoon to #10 Niskayuna.
Readers will find the current issue here and can find older issues of Capital District Data here. For more information on updated population estimates, click here. To view historic building permit data, click here.