Census Maps
The United States Census Bureau posts maps for Census Blocks on its website. You can access those maps here. CDRPC staff is available to help you navigate the site to find the maps you are looking for.
We also have prepared some maps that are available upon request.
For maps prior to 2010, please contact us.
You can view, create, and customize maps with CDRPC’s Census Mapper. For more about what the Census Mapper can do and how to use it, check out the Census Mapper Tutorial here.
2020 Census Maps
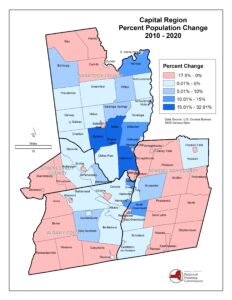
CDRPC has created two maps displaying the population changes within the capital region from 2010-2020.
The net population change map shows the top areas for largest growth are Halfmoon (+4,127), Colonie (+3,447), Malta (+2,160), Ballston (+2,142), and Guilderland (+1,590). The areas with the greatest population loss are Scotia (-457), Hoosick Falls (-285), Pittstown (-218), Duanesburg (-217), and Poestenkill (-208).
The percent population map displays the regions with the increased or decreased population changes. Overall, Saratoga county has the most municipalities with a positive percent growth between 15.01%-32.91%, which include Halfmoon, Ballston, and Malta. Rensselaer county has the most municipalities with a negative percent growth between -17.5%-0% which include Schaghticoke, Pittstown, Petersburg, Grafton, Berlin, Poestenkill, Sand Lake, Stephentown, Nassau, Waterford, and Rensselaer.

