Capital Region Economic Dashboard
CDRPC has compiled economic indicators for the region to help observe and track the region’s economic recovery. This resource page will be updated regularly. All visualizations in this dashboard can be viewed in full screen by selecting the option at the bottom right of the chart.
Employment
Employment statistics are strong indicators of the strength of the economy. COVID-19 has had a severe affect on the unemployment rate in the region, so continuously monitoring employment data can show the region’s progress towards recovery.
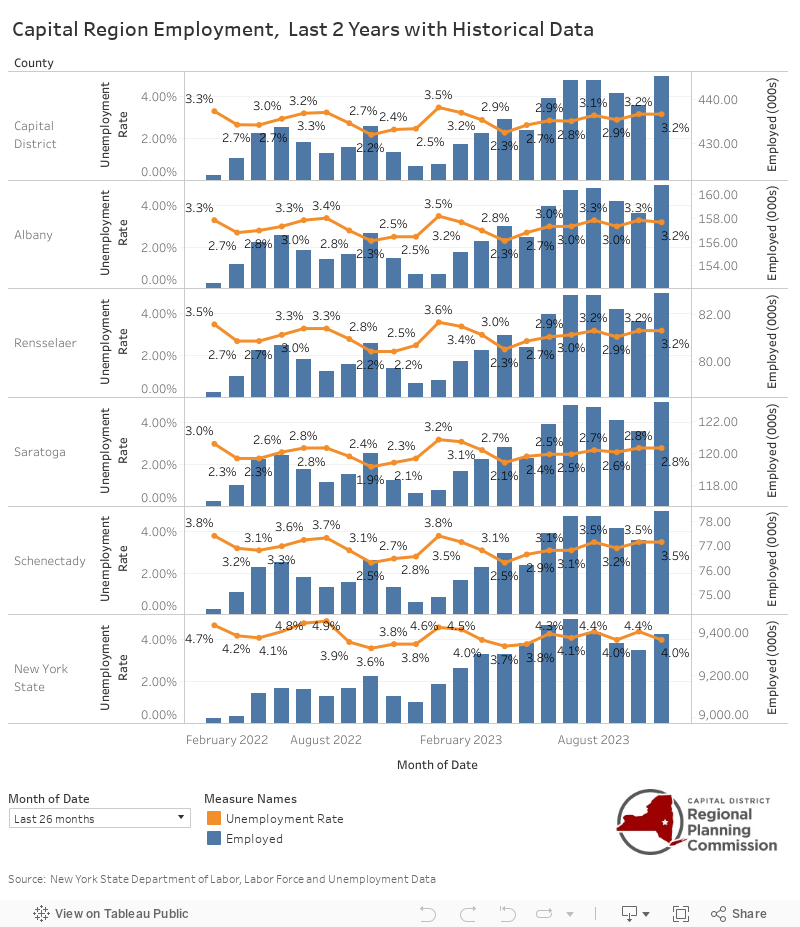
Monthly Employment & Unemployment Rate
The Capital Region Employment chart shows both the number of people employed as well as the unemployment rate. The data is broken out into the four individual counties, Albany, Rensselaer, Schenectady, and Saratoga, that make up the Capital Region. The data also provides a combined measure for the region overall. Data is displayed with the current month and the previous two years, but can be filtered all the way back to 1971.
CDRPC obtains this data from the New York State Department of Labor, who publish monthly data releases highlighting up to date changes and trends in employment throughout the state.
As of July 2020:
Albany County had an Unemployment Rate of 11.7% and approximately 144,800 employed people.
Rensselaer County had an Unemployment Rate of 11.1% and approximately 74,500 employed people.
Saratoga County had an Unemployment Rate of 10.6% and approximately 109,700 people employed.
Schenectady County had an Unemployment Rate of 13.2% and approximately 69,800 people employed.
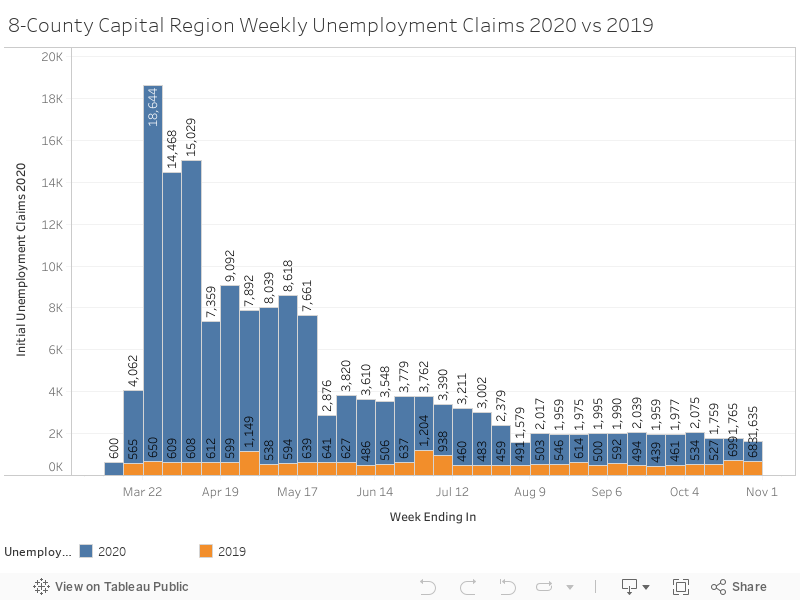
Weekly Unemployment Claims
Recently implemented by the New York State Department of Labor, Weekly Unemployment Claims shows the number of people who have filed for Unemployment every week, starting the week ending March 15th, 2020. The graph shows the number of individuals in the Capital Region who have filed for unemployment every week compared to the number of people who filed for the same time period last year.
It is important to note that for this graph, the Capital Region is defined by the 8-County Greater Capital Region including; Albany, Rensselaer, Schenectady, Saratoga, Columbia, Green, Washington, and Warren Counties.
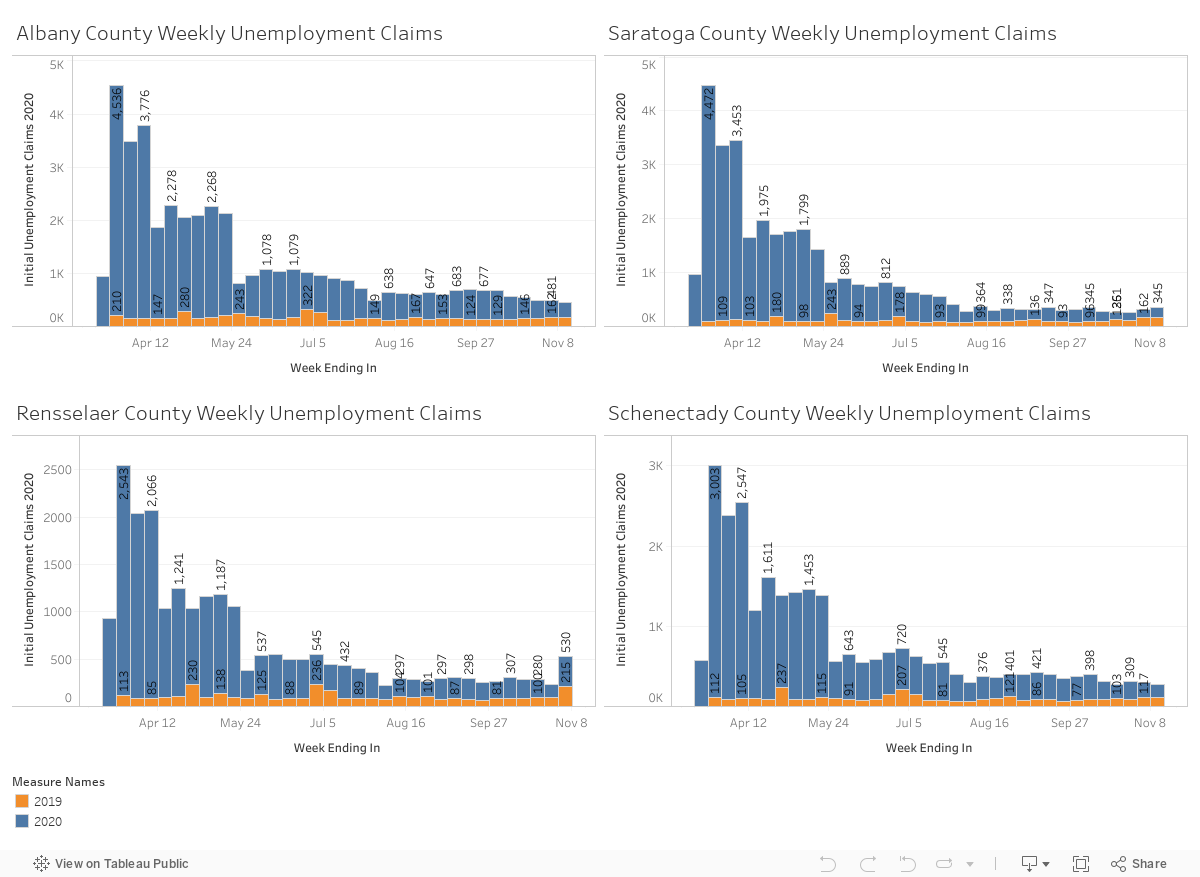
Weekly Unemployment Claims by County
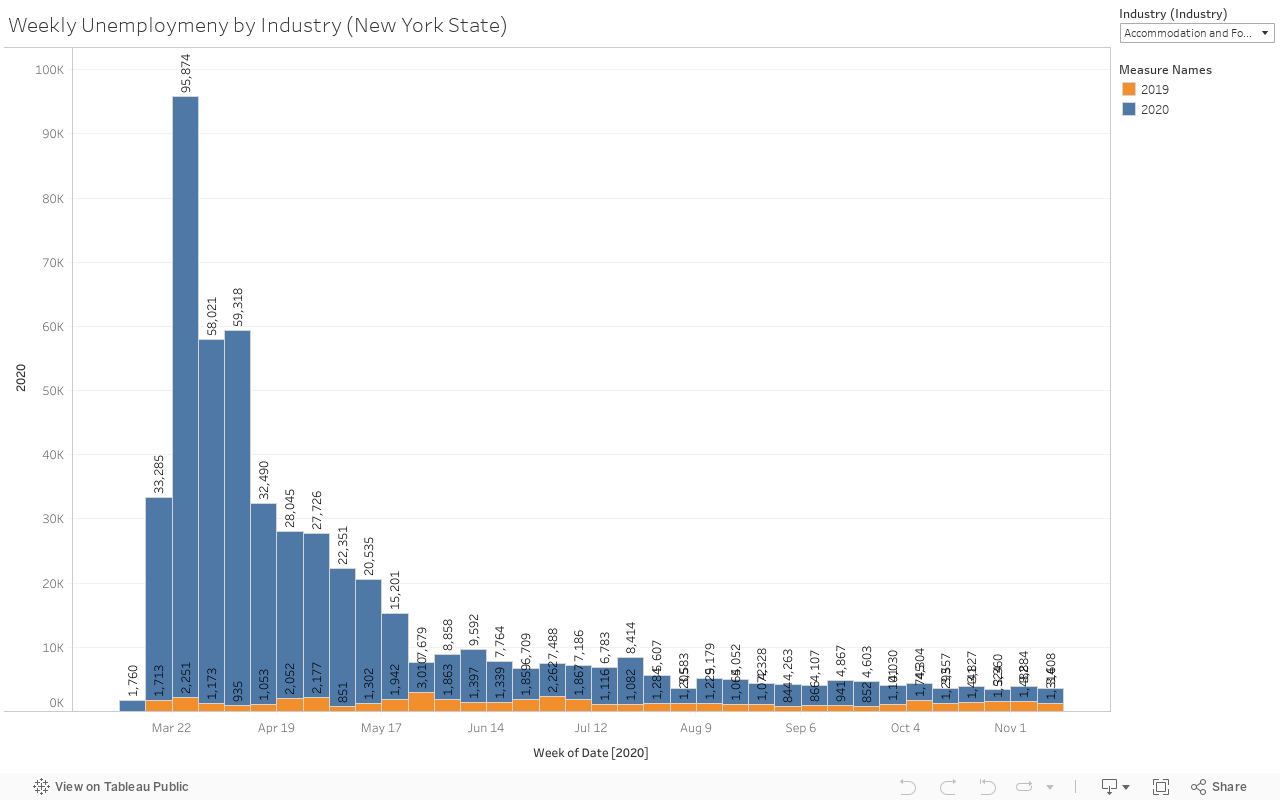
Weekly Unemployment Claims by Industry (New York State)
Housing
Housing data is a good indicator not only for the health of an economy, but for interest in an area as well. Higher rates of home ownership typically coincide with good economic conditions, and rising home sale prices in an area indicate a higher interest in moving into the area. CDRPC utilized data from Zillow for the average housing value, rent, as well as housing inventory and sales.
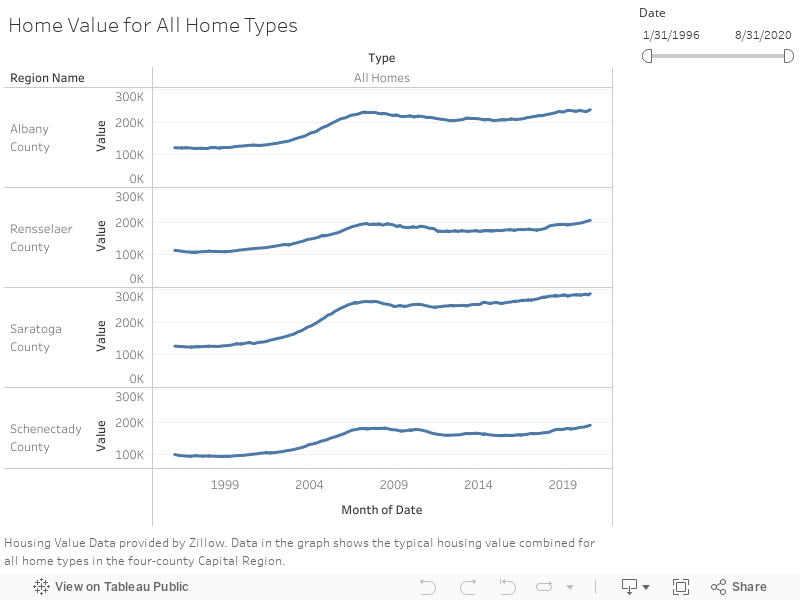
Home Values
This chart shows the typical home value for all types of homes for each of the four counties in the Capital Region. Types of homes include single-family units, as well as multi-family units, such as apartments. The aggregated value data is provided by Zillow Data and Research. You can learn more about their methodology on their website.
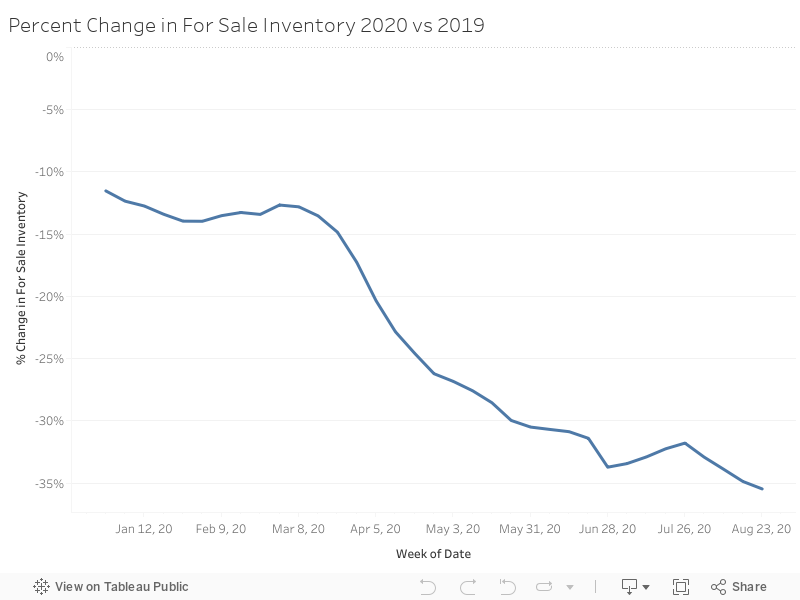
For Sale Housing Inventory
Zillow’s For-Sale Inventory is a measure of unique active listings at any given time. While this data may not be represented of every listed home in an area, it provides a good look at the overall trend of homes being listed for sale. For-Sale Inventory data in this graph is for the Albany-Schenectady-Troy Metro area.
Economic
Economic data provides a look at changes in the flow of money, the price of goods in the region, and more before and after the COVID-19 pandemic
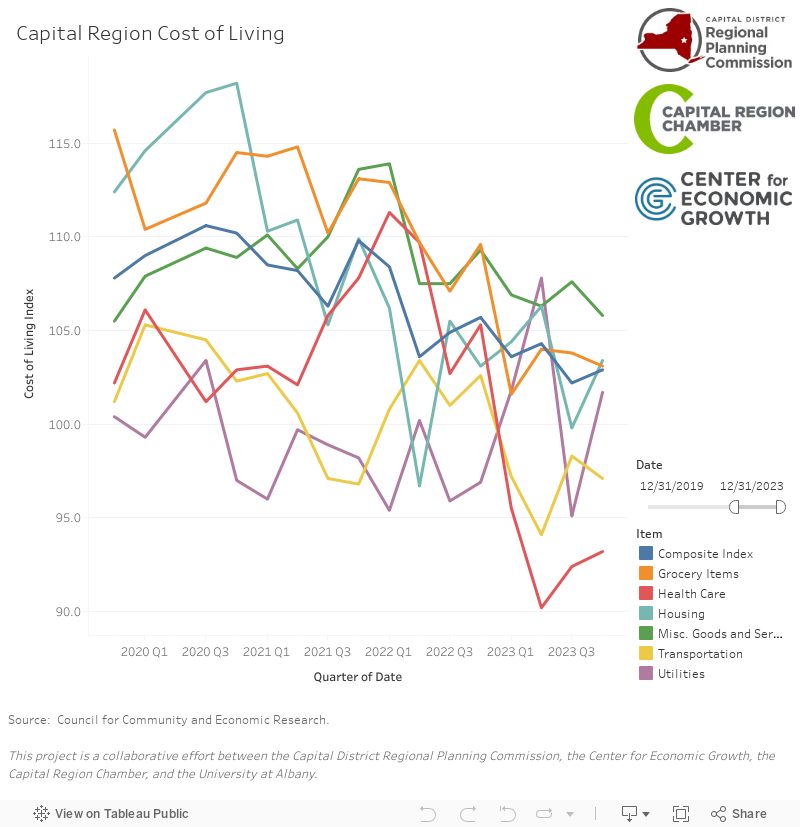
Cost of Living
The Index measures relative price levels for consumer goods and services in participating areas. The average for all participating places, both metropolitan and nonmetropolitan equals 100 and each participant’s index is read as a percentage of the average for all places.
The Index reflects cost differentials for professional and executive households in the top income quintile influencing the weighting structure. Homeownership costs, for example, are based on the average cost of housing that is greater than it would be if it reflected a clerical worker standard of living or average cost for shelter.
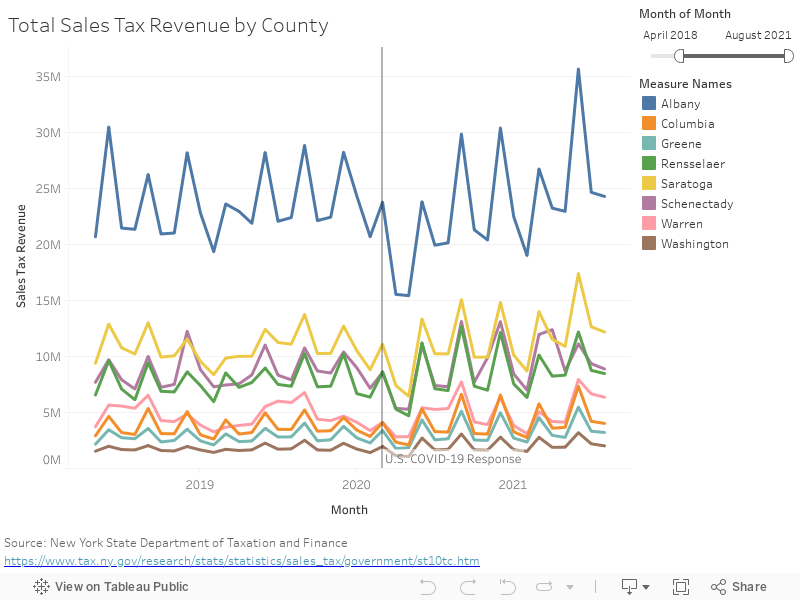
Sales Tax Revenue by County
Counties across the state utilize sales tax revenue not only to help fund budgets, but also to track economic activity within the county. Sales tax revenue is directly connected to spending within the county, so tracking trends over time helps determine how consumer habits are changing or staying the same.
Mobility
Google Mobility Reports provide insight into how our movement and travel has changed since the start of the pandemic. The reports, broken down by county, show how travel to different types of areas has changed. Check out the reports here.

Capital Region Indicators
Capital Region Indicators is a joint initiative of the Capital District Regional Planning Commission (CDRPC), Capital Region Chamber, The Community Foundation for the Greater Capital Region and the Capital District Transportation Committee . This initiative seeks to help a wide variety of public and private organizations better understand the communities of New York’s Capital Region. Using the best available information, the website serves as a common source for data and interactive visualizations that will inform community members on critical topics related to the economic and social health, as well as progress of our region.