2010 Capital Region Greenhouse Gas Inventory
In 2010, CDRPC commissioned the development of a regional greenhouse gas (GHG) inventory encompassing all major emission sources across the eight-county Capital Region REDC area. The inventory was created to support municipalities participating in the Climate Smart Communities (CSC) program and also served as the baseline for the Capital District Regional Sustainability Plan developed under the Cleaner, Greener Communities (CGC) program. Developed for the calendar year 2010 using methods, data sources, and protocols established by the CSC and CGC programs, it now serves as the baseline for comparison with the updated 2022 Regional GHG inventory.
2010 Greenhouse Gas (GHG) Inventory Dashboard
CDRPC created a GHG Inventory Dashboard that provides easily accessible, detailed information for communities across the region.
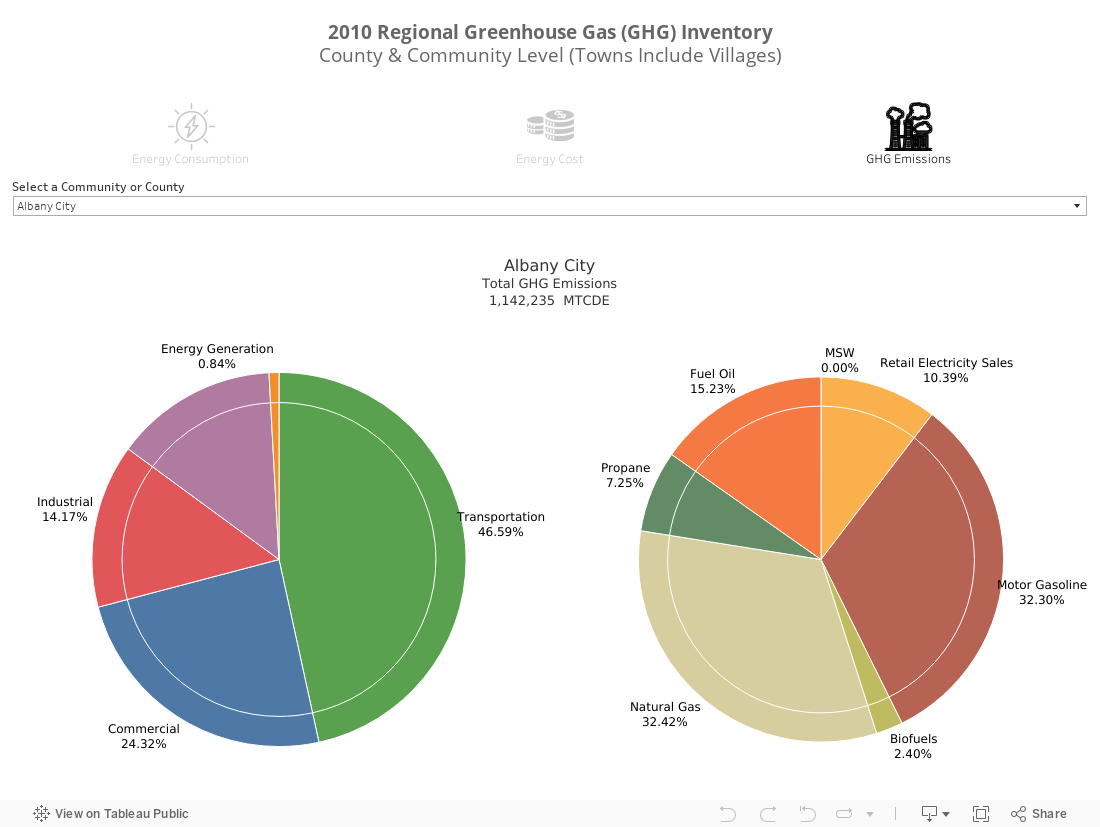
Capital District 2010 Regional Greenhouse Gas Inventory by CDRPC
Highlights from the GHG Inventory
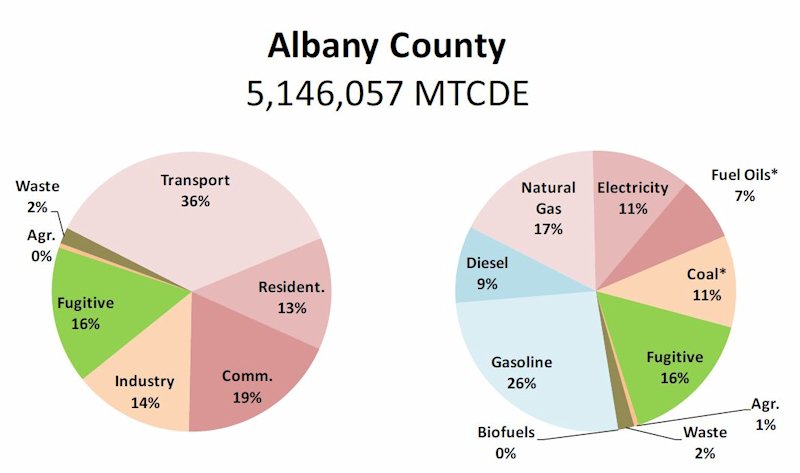
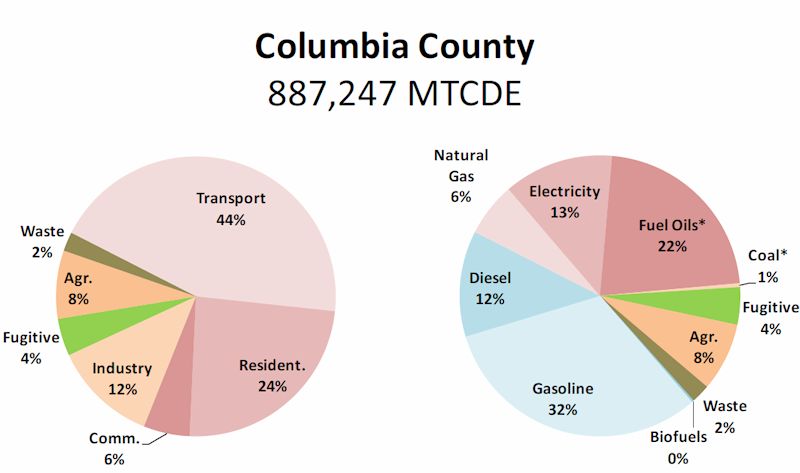
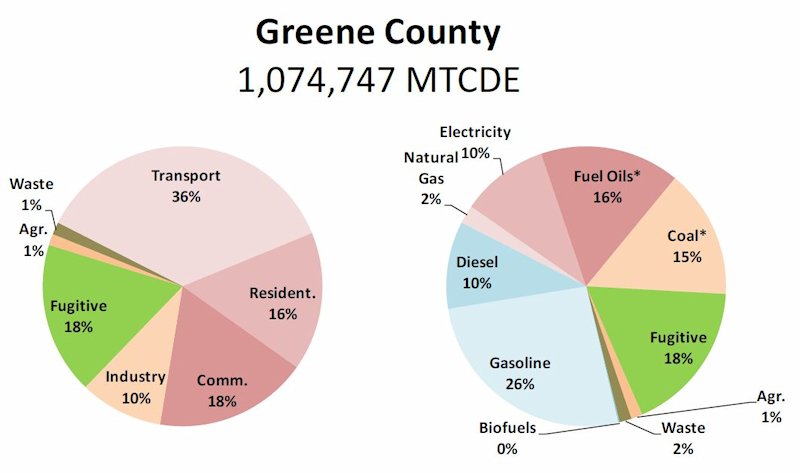
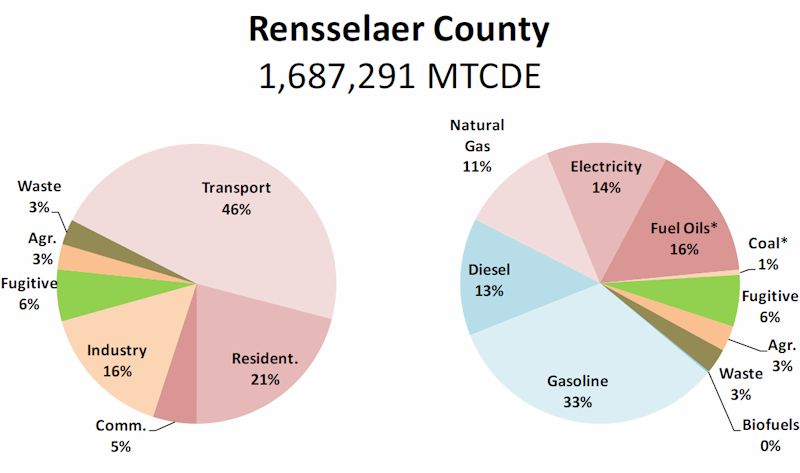
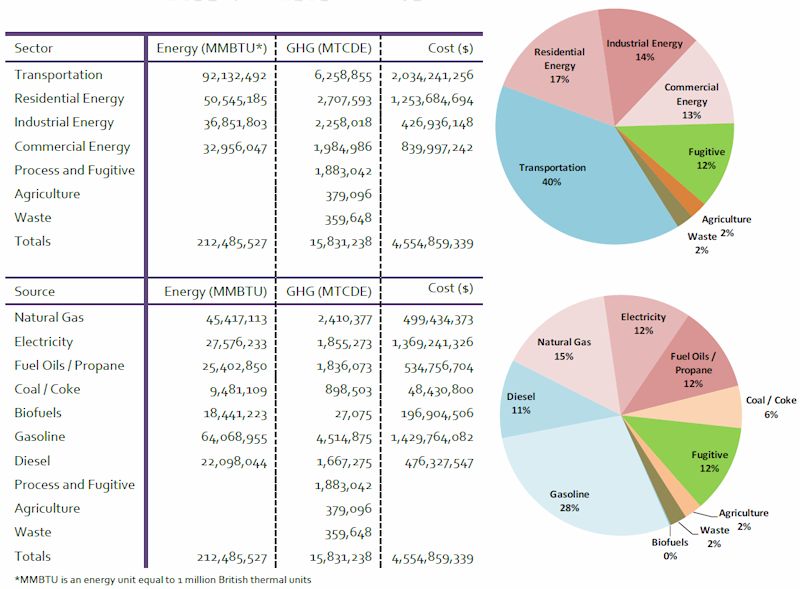
In 2010, the Capital District emitted about 15.8 million metric tons of CO₂ equivalent GHGs. Transportation fuels accounted for 40% of emissions, followed by residential (17%), industrial (15%), commercial (14%), and fugitive emissions (12%). Agriculture and waste each contributed 2%.
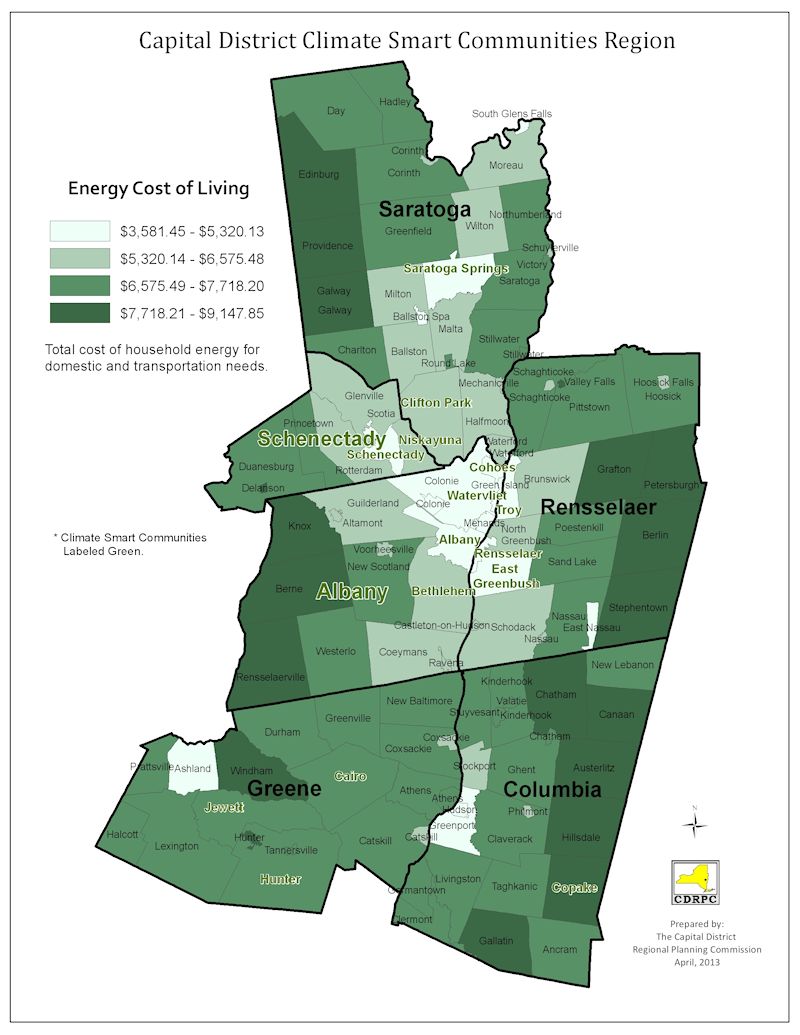
Residents and businesses spent $4.5 billion on energy, with $2.9 billion on petroleum fuels. Rising petroleum costs increased regional fuel expenses by $1.75 billion annually—about $1,600 more per person—hitting rural, lower-income areas hardest.
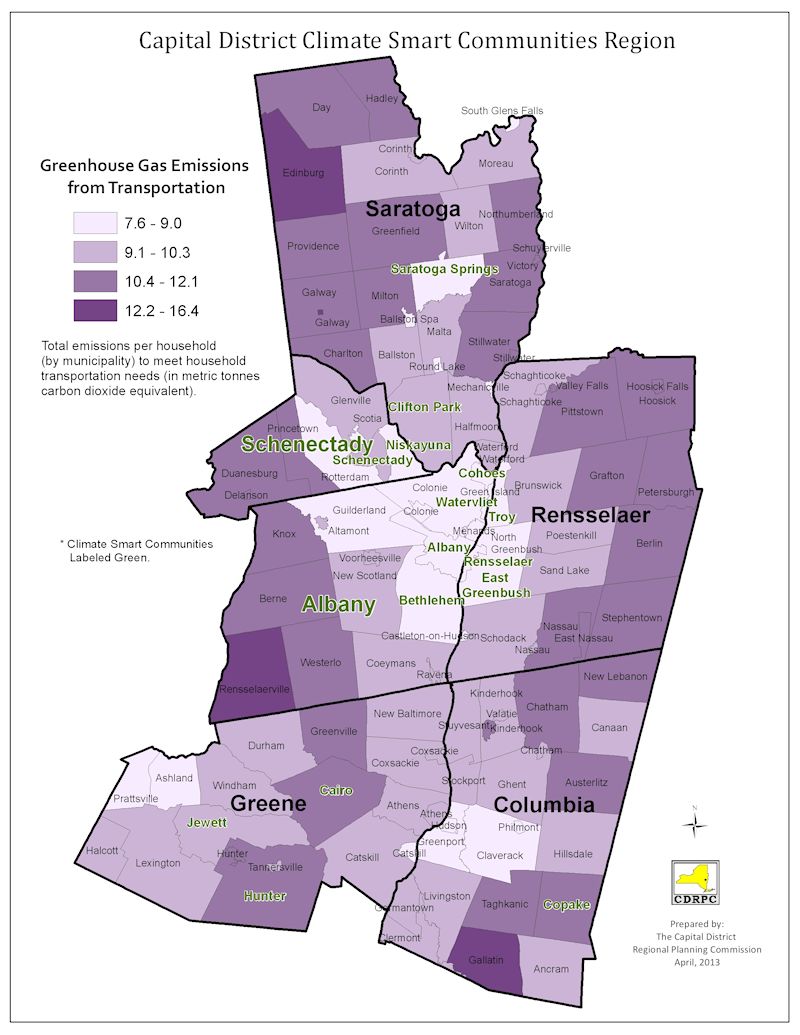
Transportation fuels dominated all counties’ emissions, but shifting 20% of gasoline vehicles to electric was projected to cut regional emissions by 4.5% and save $174 million in fuel costs. Upstate New York’s low-carbon electricity offered a strong advantage for electrification and emissions reduction.
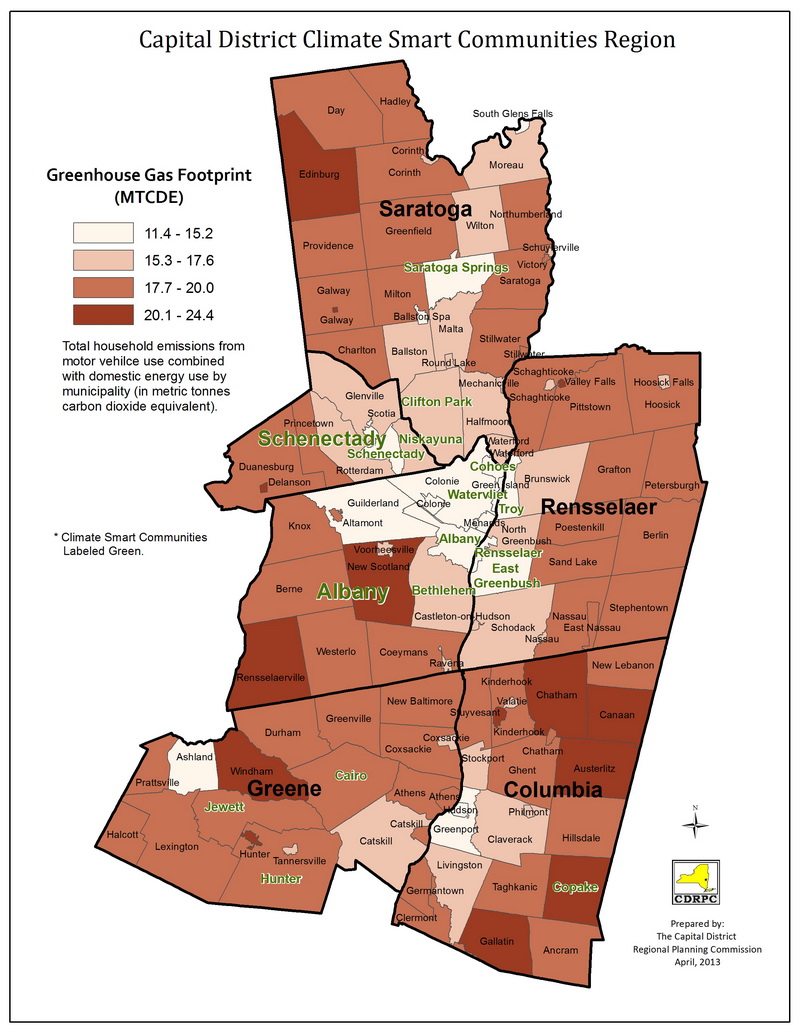
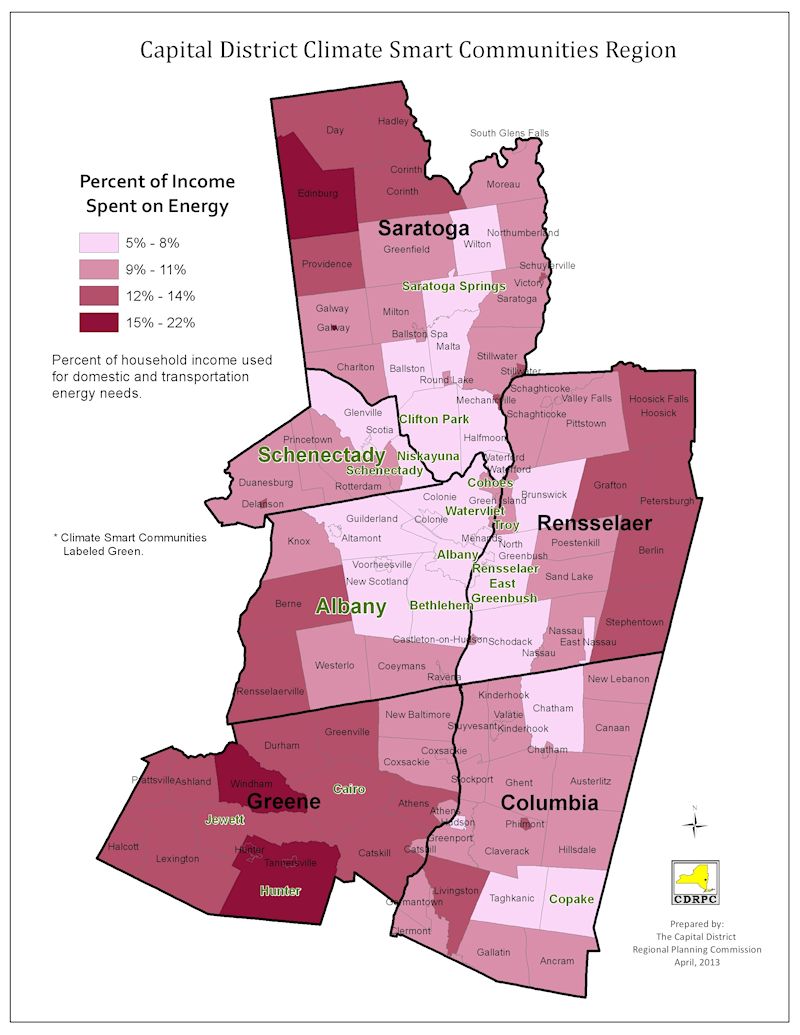
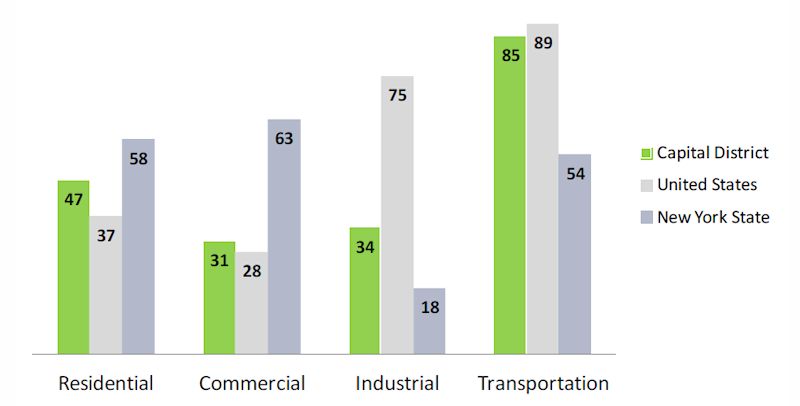
Compact, transit-accessible communities emitted 31% less GHG and had 39% lower energy costs than rural areas, where households consumed up to three times more energy and spent 15-18% of income on energy, compared to 5-7% in urban communities.
2010 New York vs. US Grid Electricity Generation Mix

2010 Regional GHG Emissions By Sector and Source
2010 Energy Use by Sector per Capita (MMBTU/person)
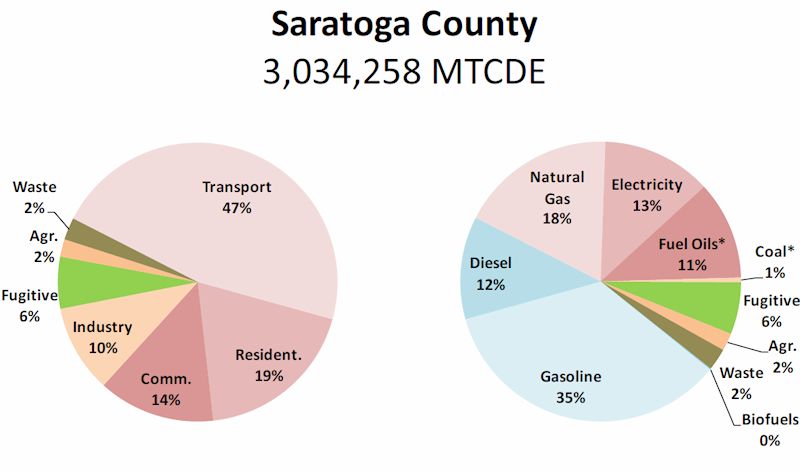
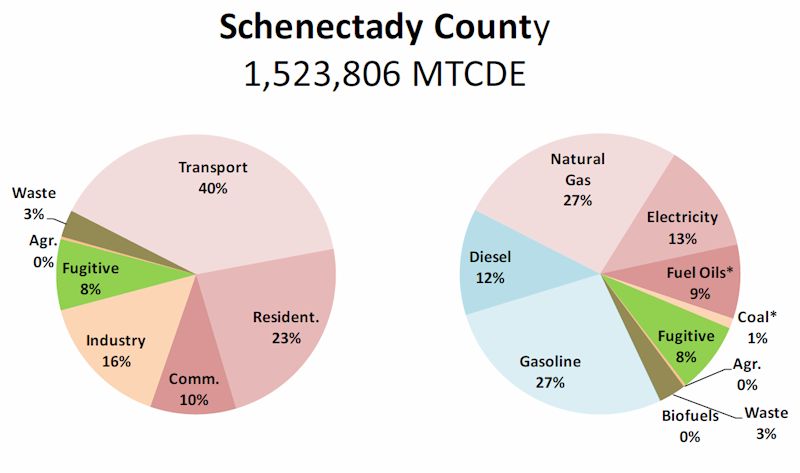
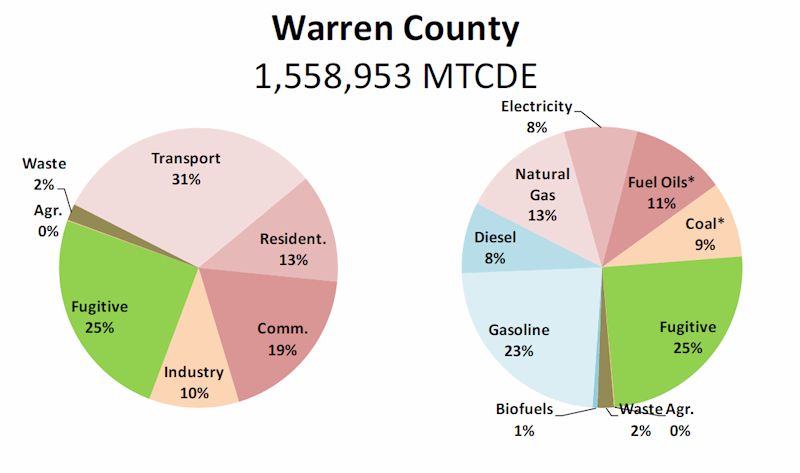
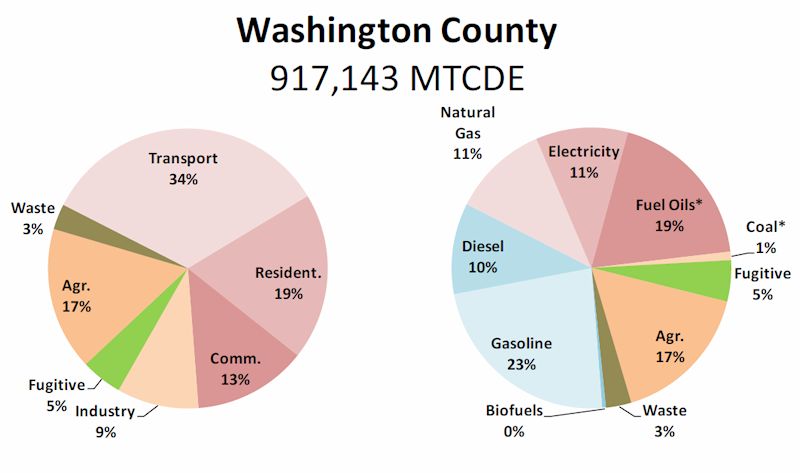
2010 GHG Emissions by County (MTCDE)
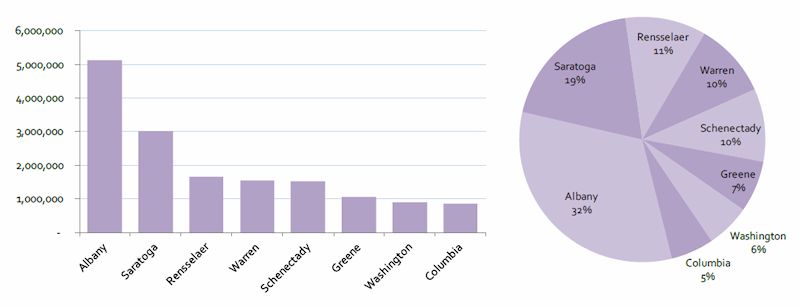
2010 GHG Emissions by County, by Source and Sector (MTCDE)