Consumer Prices Remain Stable, Producer Prices Index Recovering
After seeing shifts due to COVID-19, both the Consumer and Producer Price Indexes seem to be returning to pre-pandemic levels over the past few months. The Producer and Consumer Price Indexes are important indicators of the economy as they measure the costs that consumers pay for different categories of items and the price that producers sell their products for. The Consumer Price Index saw relative stability throughout the year, with increases in some cost categories being offset by decreases in other categories. In a recent article, the Wall Street Journal reported that the Consumer Price Index was stable over the past few months. The rate of decline was much higher for the Producer index, signaling that the pandemic had a significant effect on the economy and that the economy has been slowly recovering over the past few months.
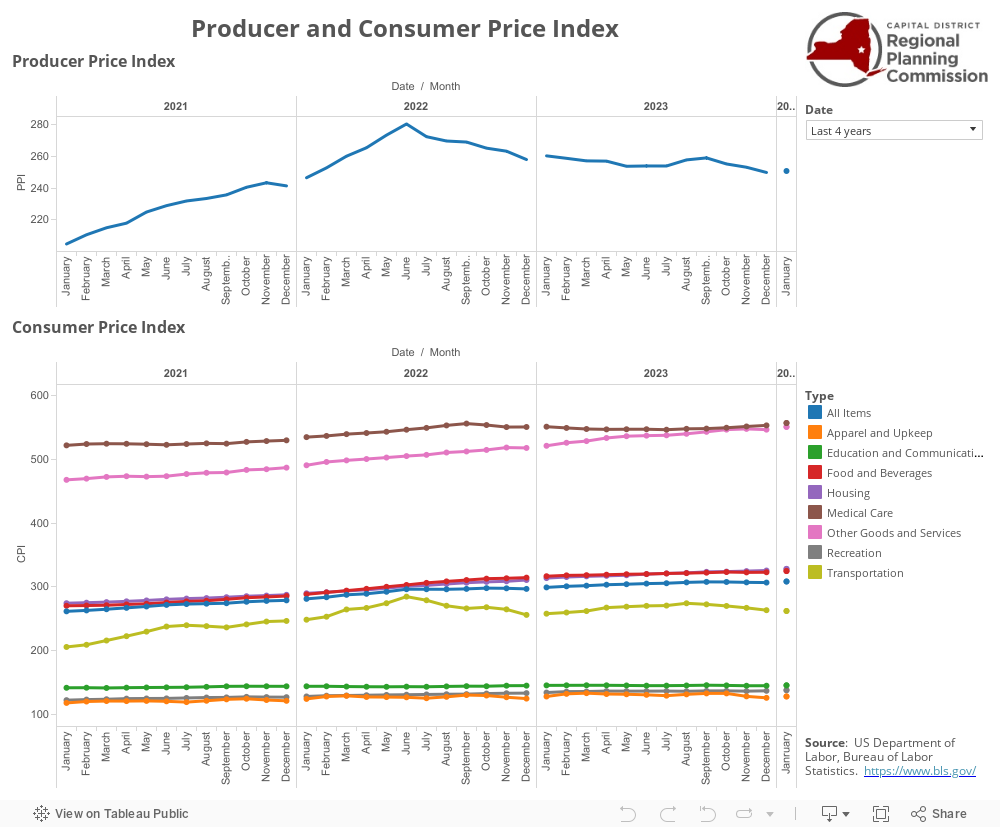
The Producer Price Index (PPI) saw a significant drop in April 2020, the first full month after the coronavirus broke out in the United States. The PPI was already decreasing through the first three months of 2020, but the rate of decline increased greatly in April after COVID-19 took effect. The PPI decreased from 199.4 in January 2020 to 193.8 in March 2020. In April 2020, the PPI fell to 186, the lowest point it has hit in the past 4 years. Since hitting this low, however, the PPI has seen consistent growth since May 2020. In October 2020, the PPI increased to 195.9, higher than where it was in March. This is a positive sign for economic recovery nationally. However, with rising coronavirus cases across the country and uncertainty about future stimulus, it will be important to continue to monitor the PPI to determine if recovery continues or if the economy begins to slip back down.
The Consumer Price Index (CPI) is composed of eight separate categories that people spend money on. Each category responds differently to different events, but are consolidated into an “All Items” category that measures the aggregate change in prices. The All Items category is typically very stable month to month, with changes rarely greater than 1.0. However, between March 2020 and April 2020 the CPI decreased from 258.1 to 256.4, a decrease of 1.7. While a larger than normal change, this decrease did not drop the CPI out of its normal range over the past 4 years.
Looking at the individual categories, Transportation and Apparel and Upkeeping saw the largest declines. Transportation dipped below 200 for the first time since July 2017 in April, May, and June 2020. Transportations costs hit their lowest point in May 2020, reaching 191.4. Apparel and Upkeep saw similar declines, with the category hitting its lowest point in the past four years in July 2020 at 114.3. While seeing increases in the past few months, both categories have yet to return to pre-pandemic levels. Decreases outside of normal levels are significant, as they indicate that fewer people are spending money in that category.
In terms of categories that saw increases, Food and Beverages and Medical Care saw the highest increases. Food and Beverages have been slowly but consistently increasing over the past four years. However, the category saw a jump out of the normal range in April 2020. In March 2020, the category was at 262.3 but saw a jump to 266.1 in April 2020. This was the highest point Food and Beverages had reached at the time in the past four years and was a much higher month to month increase than the category has seen. In October 2020, Food and Beverages hit its highest point of the past four years at 269.2.
Medical Care had also been steadily increasing over the past four years, and it does not seem like the pandemic shifted the category’s course out of the path it was already on. In January 2020, Medical Care costs, the highest of any cost category, were at 512.1. That increased through August 2020 where it reached a high of 523.3. The category has seen slight decline in the following two months, reaching 520.7 in October 2020.