Change of Address Requests into Capital Region Increase Since Start of Pandemic
Migration from the New York City area into the Capital Region has seen a significant increase since the beginning of the pandemic. Utilizing USPS Change of Address data, which tracks the number of requests to change addresses from one county to another, we can analyze the number of people moving into the Capital Region before the pandemic and after. The data included in this analysis only registers when there were ten or more requests in a given month. Any county with less than ten change of address requests into the Capital Region in a given month was not included in the USPS data set. For this analysis, we looked at address changes from the five New York City area counties, New York County (Manhattan), Kings County (Brooklyn), Bronx County (The Bronx), and Queens County (Queens) into the four Capital Region counties. Data from Richmond County (Staten Island) did not meet the threshold of ten address changes from the origin county to destination county, which is why it is not included in the following analysis. In months with no data appearing in the chart, it reflects the number of address changes in that month was less than ten.
While there was limited migration from the New York City area in the years before the pandemic, migration has taken place at a higher rate for each of the four Capital Region counties since March 2020. Albany County has seen the most change of address requests since the beginning of the pandemic. Both Rensselaer and Saratoga counties had seen limited change of address requests since 2018 but saw a significant increase in the rate of requests after March 2020. CDRPC will continue to gather USPS Change of Address data and provide updates throughout the year.
Albany County
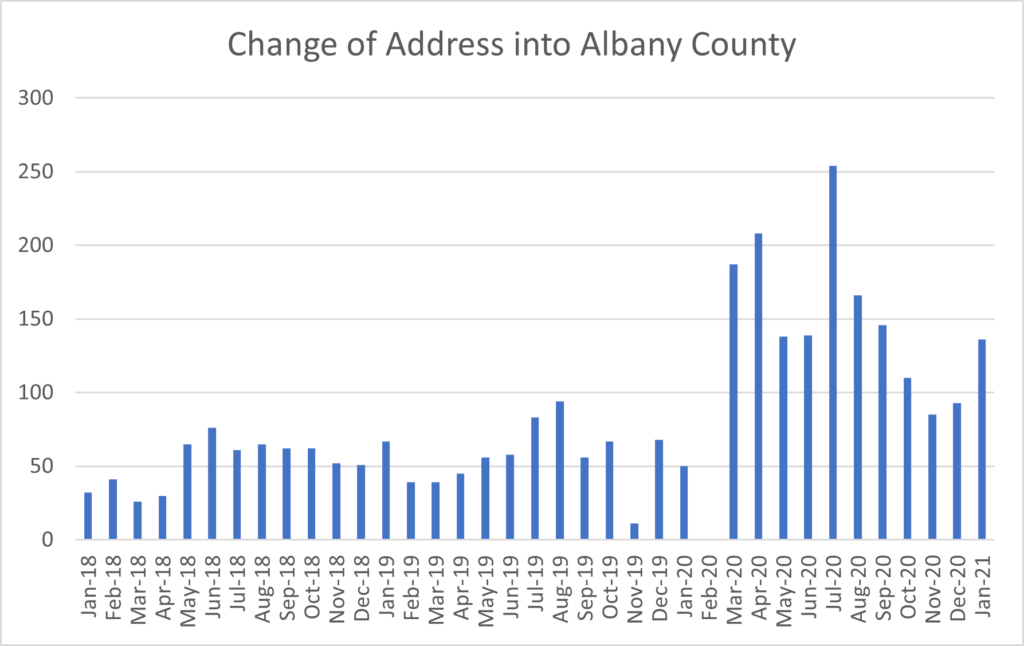
Of the four Capital Region Counties, Albany County has seen the highest amount of migration since the beginning of the pandemic. While the county had seen steady migration from the NYC area, the number of people migrating into the county increased significantly. In all of 2019, there was approximately 683 total change of address requests from the NYC area into Albany County. From just March 2020 through January 2021, there was 1,662 change of address requests. In just the month of July 2020 alone, there were 254 requests.
Rensselaer County
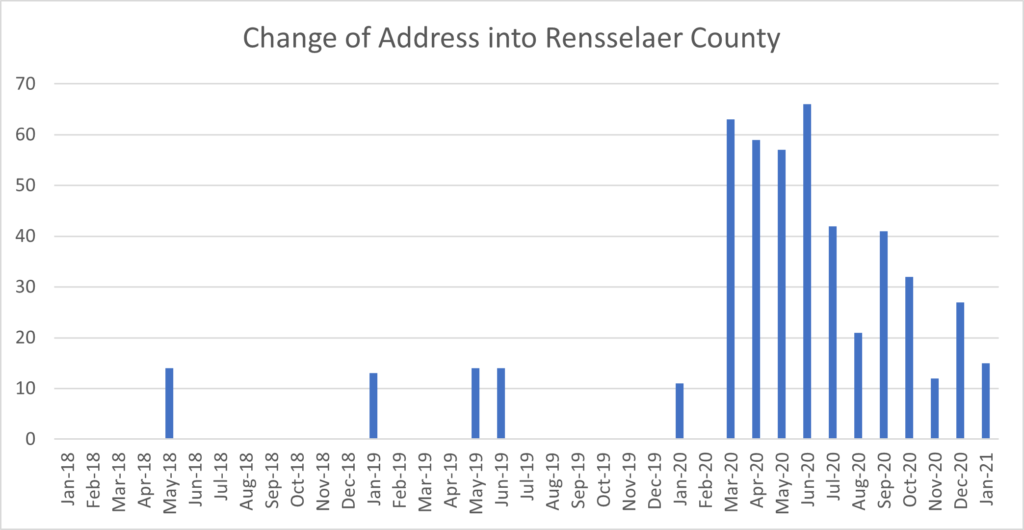
While Rensselaer had limited migration in the years before the pandemic, the county has had a spike in migration since March 2020. Between January 2018 and February 2020, Rensselaer County had approximately 66 total requests. Since March 2020, there have been 435 requests. Requests were the highest between March 2020 and June 2020, where requests were consistently above 50 per month. The rate of requests has declined overall since June, but through January 2021 remains above or equal to the pre-pandemic rate.
Saratoga County
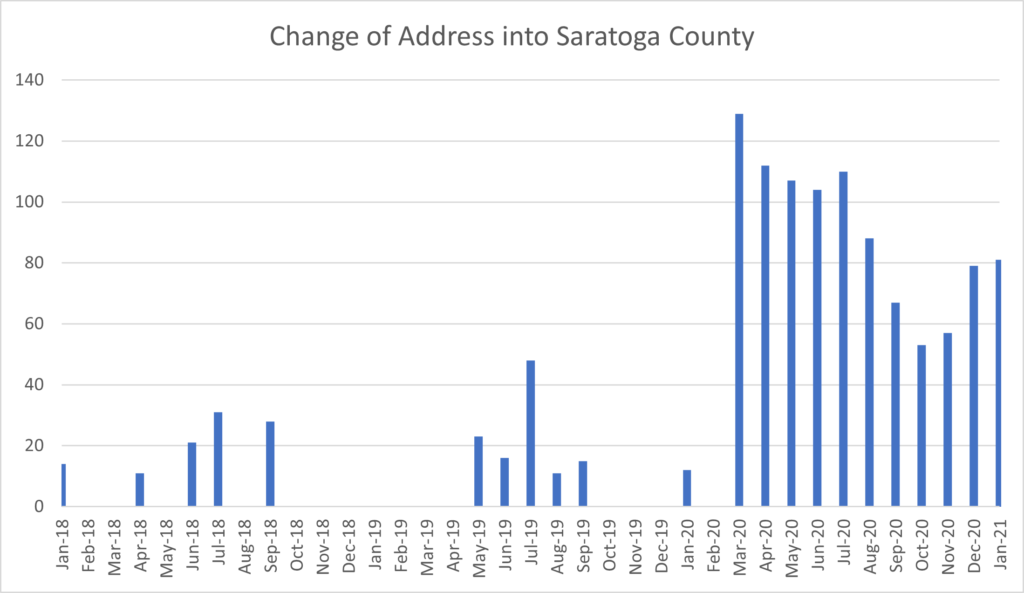
Similar to Rensselaer, Saratoga had relatively limited migration from the NYC area before the pandemic. Between January 2018 and February 2020, Saratoga had 230 total requests. Between March 2020 and January 2021, there were 987 total requests. March 2020 saw the most single-month requests for Saratoga County with 129 total requests. The rate of requests decreased steadily until December 2020 and January 2021, where there was another bump in requests.
Schenectady County
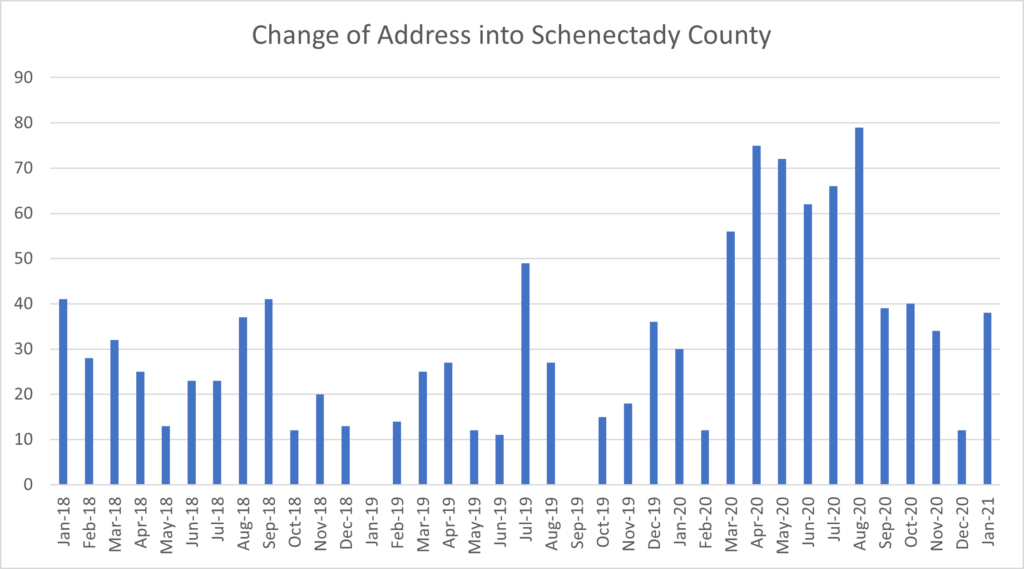
Similar to Albany County, Schenectady County had seen steady change of address requests before the pandemic. In 2019, the county had approximately 234 total requests. Between March 2020 and January 2021, the county had 573 total requests. The most single-month requests came in August 2020 with 79 total requests. Requests dropped after August and are near pre-pandemic levels.
Closed Sales Data
While USPS Change of Address data is a good indicator of movement into the region, it does not necessarily mean that people are staying permanently in the region. To help supplement the change of address requests, we can utilize closed sales data from the Greater Capital Association of Realtors (Global MLS). Closed sales refer to the number of completed home sales in each month. While closed home sales data do not tell us where people are buying homes from, higher home sales in a county could help indicate that some of the change of address requests could be for people who decided to purchase homes in the region. Currently, the Capital Region’s real estate market is very hot, with high demand and a shortage of supply of homes for sale. We will continue to gather data on the region’s housing market and provide updates throughout the year.
Albany County
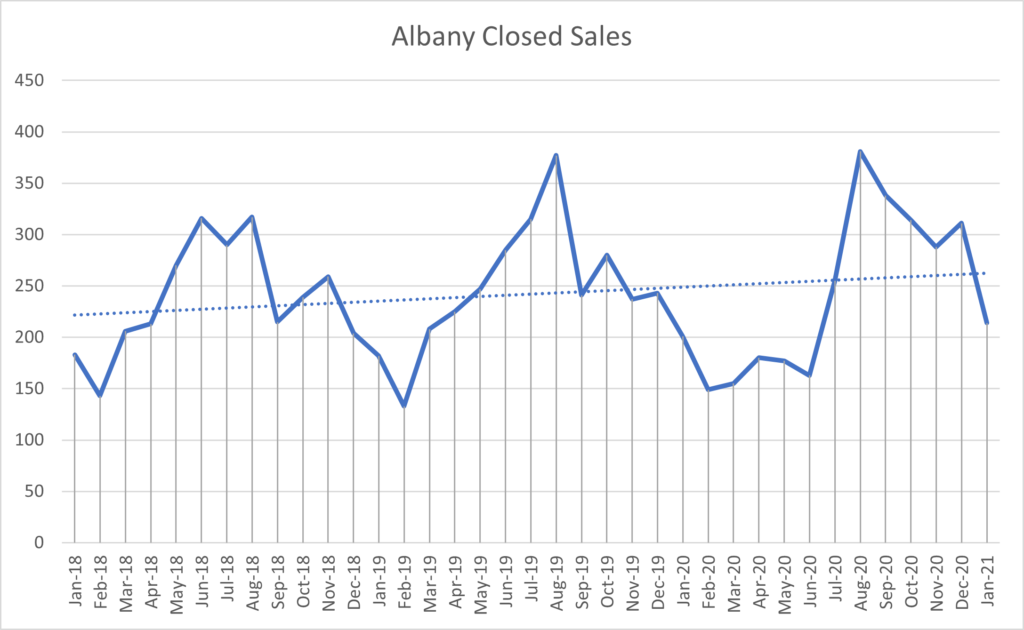
Albany County’s closed home sales in 2020 appeared to be following a similar trajectory as 2019’s sales until August and the following months. August 2020 saw the highest number single month of closed sales with 381 total sales. After August 2020 and through January 2021, closed home sales have remained higher than the monthly totals of both 2019 and 2018.
Rensselaer County
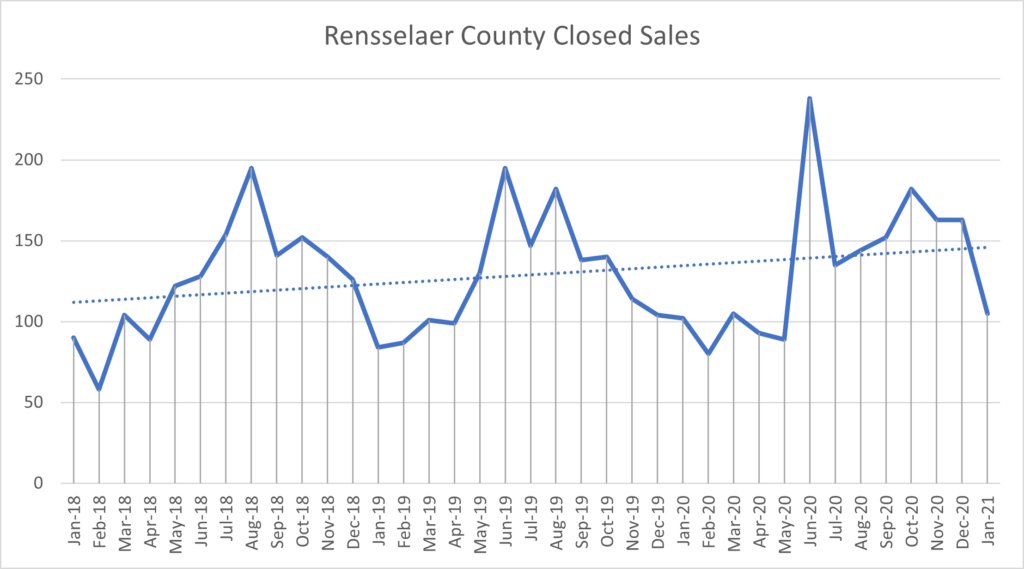
Rensselaer has also seen increased closed home sales in the second half of 2020. Rensselaer County saw declining home sales at the beginning of the pandemic, March through May 2020. In both 2019 and 2020, the county saw a spike in sales, however, 2020’s spike was much higher than 2019’s. In June 2020 there were 238 total closed sales, the highest single-month total since 2018. July 2020 sales dropped down below both 2018 and 2019’s levels but continued to rise back up in the following months. August 2020 through January 2021 have all been above the level of the same months in both 2018 and 2019.
Saratoga County
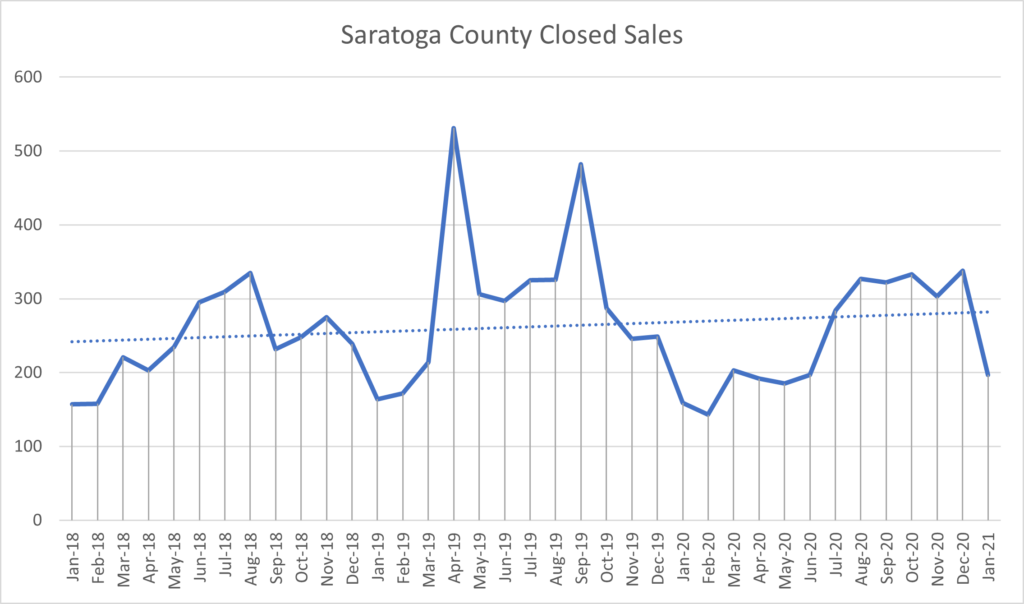
Saratoga County largely remained on trend for home sales over the past year but has been higher than average towards the end of 2020. Since 2018, the county has seen home sales increase around April. However, while in 2018 and 2019 home sales have dipped below 300 after September, 2020’s closed home sales remained above 300 per month from August through December. January 2021 saw closed home sales dip back down below 200 but was still the highest January total since 2018.
Schenectady County
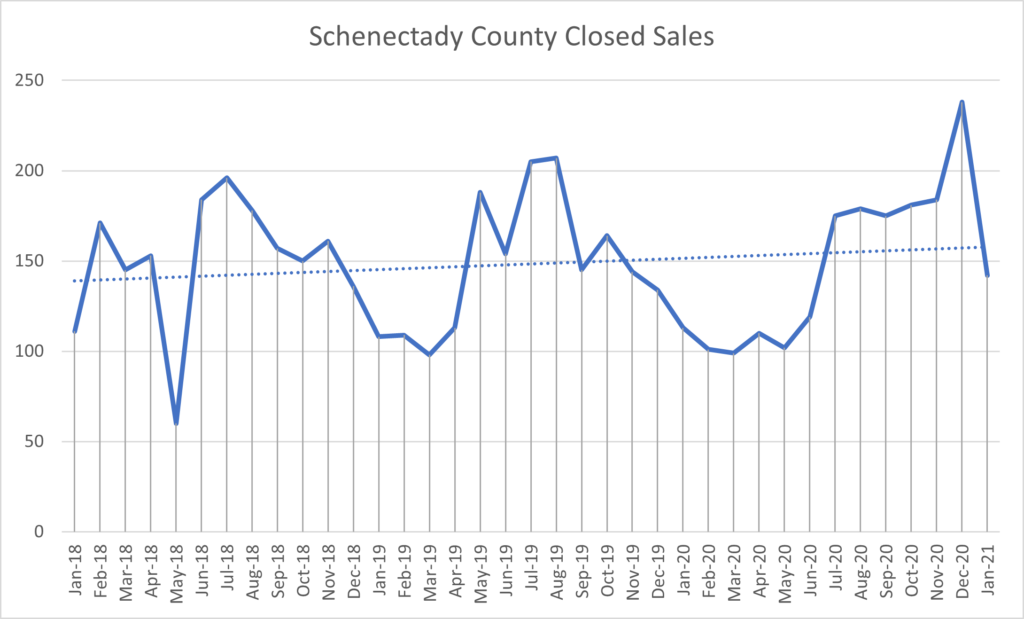
Similar to the other Capital Region Counties, Schenectady County saw above-average increases in closed home sales in the later months of 2020. In both 2018 and 2019, closed home sales increased through July or August and then began to decrease. In 2020, however, sales increased after August until they reached the highest single-month total of 238 in December. Sales dropped in January 2021 but are still higher than the January sales of 2020, 2019, and 2018.
Conclusion
The USPS change of address data shows potential movement into the capital region from New York City counties and while some home sale closings have increased at the same time, the increases may not deviate from the overall trend as significantly. This could point to a significant percentage of those changes of address relate to renters or other temporary housing situations like weekend homes.
Footnote
* – Data included in charts is given for counties from the NYC area that had more than 10 requests in a given month. The USPS uses 10 requests as the threshold to display data. For any given month in the chart, there could have been more change of address requests than listed because a county with less than ten requests but more than zero would register as zero.