Consumer and Producer Price Indexes Have Increased to Highest Levels in the Past 4 Years
In December of 2020, CDRPC provided an update of the Produce Price Index (PPI) and Consumer Price Index (CPI) and noted that after both experienced a dip, the indexes seemed to be recovering through October 2020. The Producer and Consumer Price Indexes are important indicators and can provide insights on inflation and deflation. While both the PPI and CPI have seen significant increases in October 2020, it may be too early to tell if we are entering a period of inflation. With data now available through April 2021, both indexes have continued to increase above pre-pandemic levels. The PPI has seen a significant increase since October 2020, increasing from 196.5 to 217.5 in April 2021. The Composite Index of the CPI, which aggregates all the categories the CPI measures into one, increased from 260.4 in October 2020 to 267.1 in April 2021.
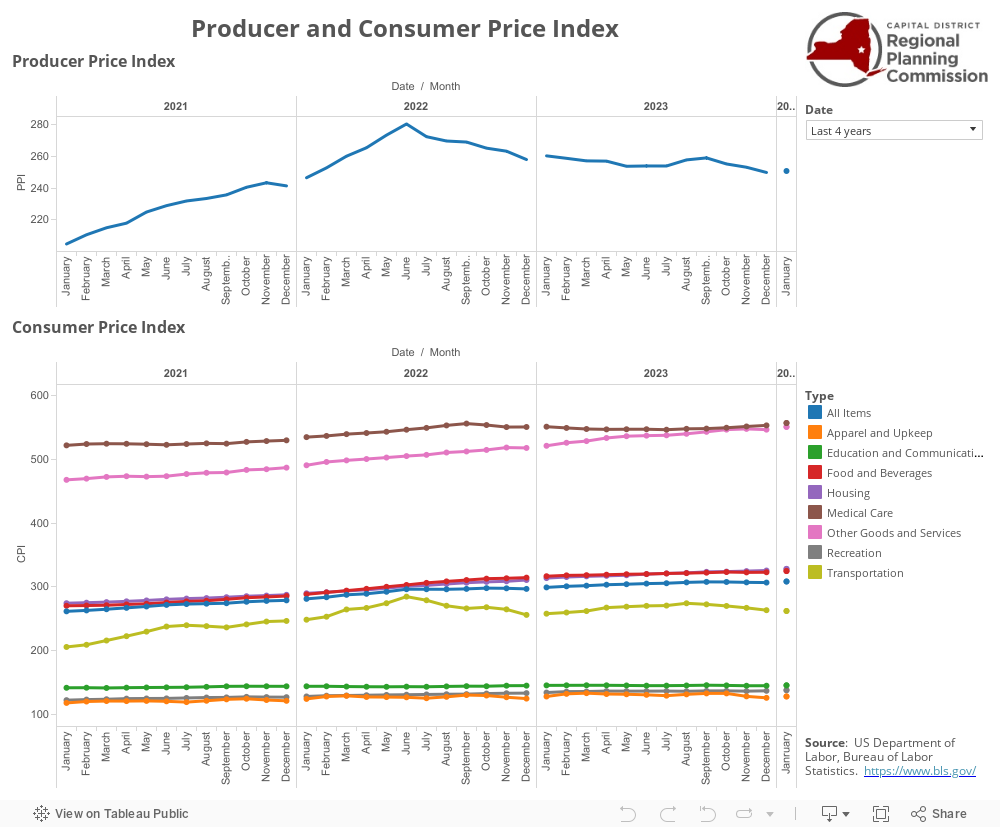
The Producer Price Index represents the price that producers sell their goods at and is an aggregate for all goods sold. The PPI hit a low of 185.5 in April 2020 at the beginning of the pandemic but has been increasing ever since. Between April and October 2020, the PPI increased from 185.5 to 196.5 which represents a 5.9% increase. However, since October the rate of increase has grown significantly. In April 2021, the PPI reached 217.5, an increase of 10.7%. Between October 2020 and April 2021, the PPI increased at double the rate it did in the previous six-month period. April 2021’s level is the highest the PPI index has reached in the past 4 years.
The Consumer Price Index (CPI) is composed of eight separate categories that people spend money on. Each category responds differently to different events but is consolidated into an “All Items” category that measures the aggregate change in prices. After reaching 260.4 in October 2020, the “All Items” category saw a month of decline to 260.2 in November but bounced back to 260.5 in December. Since the start of the new year, the “All Items” index has continued to rise at a faster than average rate. Between January 2021 and April 2021, the Index increased from 261.6 to 267.1. Like the PPI, April 2021 is the highest the “All Items” category has reached in the past four years.
Between October 2020 and April 2021, all the individual categories tracked in the CPI saw increases. Transportation and Other Goods and Services saw the largest increases overall. Transportation saw the highest increase of any individual category, rising from 203.1 in October 2020 to 222.5 in April 2021. Other Goods and Services saw the second-highest increase of the individual categories with an increase from 463.9 in October 2020 to 473.6 in April 2021.
Housing, Medical Care, and Food and Beverage Costs have also seen increases over this time. Housing increased from 273 to 277.3. Medical Care and Food and Beverages saw similar rates of increase with Medical Care increasing from 520.7 to 524.6 and Food and Beverages increasing from 269.2 to 272.4 between October 2020 and April 2021.
While these indexes have increased, the U.S. economy overall is still not fully recovered from the pandemic. According to this article from the New York Times, different sectors of the economy are recovering at different paces and it is still unclear how long a full recovery will take. For example, while the CPI and PPI have seen increases, the unemployment rate in the Capital Region and the country overall have still not recovered to pre-pandemic levels. Make sure to stay connected with CDRPC as we continue to track economic recovery!