PPI Remains Elevated Above Pre-COVID Levels
The Capital District Regional Planning Commission (CDRPC) has updated Producer Price Index (PPI) and Consumer Price Index (CPI) data through 2025. These indices provide vital insights into the country’s economy, offering a snapshot of how businesses and consumers are experiencing changes in prices.
Producer Price Index (PPI): The Producer Price Index (PPI) measures the average change over time in the selling prices received by domestic producers for their output. Prices included in the PPI are based on the first commercial transaction for many products and some services. This index reflects the cost pressures facing businesses, which can influence the prices consumers pay later on.
Consumer Price Index (CPI): Measures changes in the prices paid by households for a typical basket of goods and services, such as food, transportation, and housing. It’s a critical indicator of inflation and purchasing power.
Both indices are essential for understanding economic dynamics, helping businesses, policymakers, and residents navigate economic challenges and opportunities.
Use the date filter on the visualization below to explore more historic data.
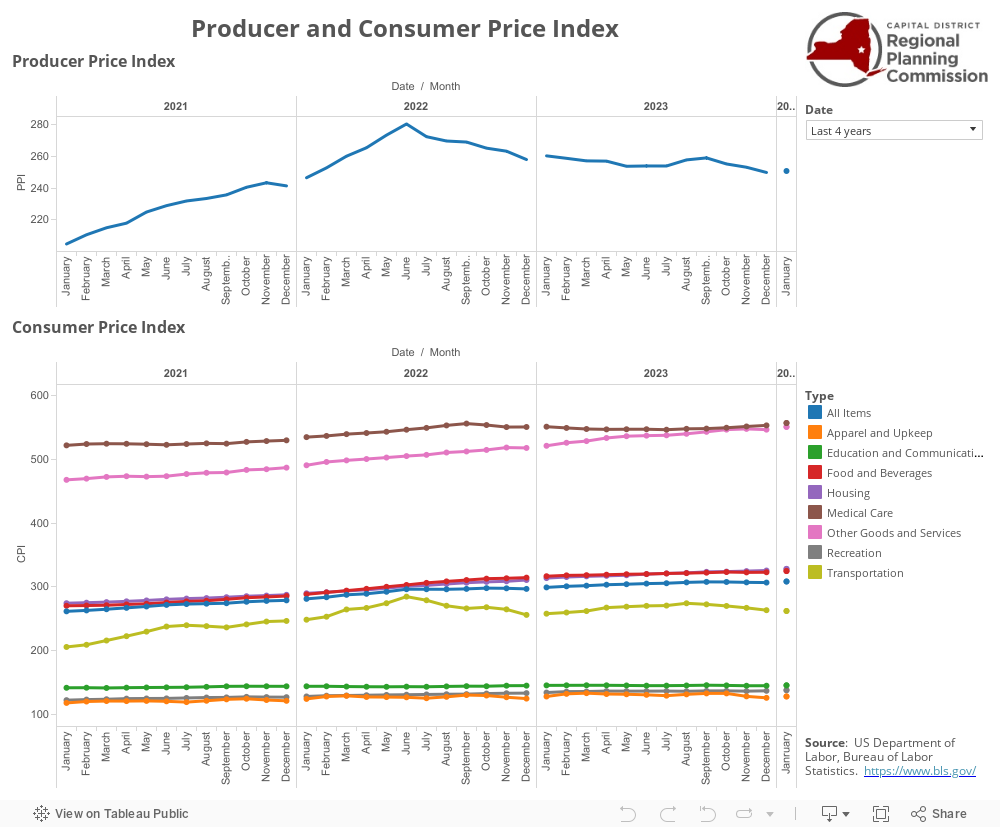
Producer Price Index (PPI)
The Producer Price Index (PPI) exhibited an overall upward trend throughout 2025, rising from 257.36 in January to 260.686 in December, representing a 1.29% increase over the year and an average annual percent change of +0.12%. This growth suggests that producers received higher prices for their goods and services during this period. Such an increase could reflect rising costs for raw materials, labor, or other inputs, which may eventually influence consumer prices.
When compared to the annual average PPI of 254.599 in 2024, the 2025 average PPI of 260.190 marks a 2.21% increase. Over the past three years, the PPI has remained relatively stable. However, following the onset of the COVID-19 pandemic, the PPI saw a significant surge, from an annual average of 199.842 in 2019 (pre pandemic) to above 250 in subsequent years, highlighting sustained increases in production costs well beyond the pandemic onset.
Consumer Price Index (CPI)
The CPI is calculated by taking the prices of a specific set of goods and services, known as the ‘market basket’ and comparing them to the prices of the same items during a base period. The changes in the CPI are used to assess price changes in these categories over time and help reflect the overall inflation rate.
From January 2025 to December 2025 CPI changed as shown below:
- Apparel and Upkeep: -0.31%
- Education and Communication: +0.21%
- Food and Beverages: +2.43%
- Housing: +2.99%
- Medical Care: +2.66%
- Recreation: +1.71%
- Transportation: -0.67%
- Other Goods and Services: +4.06%
- All Items (Composite Index): +2.01%
Between January and December 2025, only Apparel and Transportation experienced a decline in prices. Other Goods and Services saw the largest increase at 4.06%, well above the overall inflation rate of 2.01%. Housing, Food, and Medical Care were also significant contributors to the overall rise, highlighting ongoing cost pressures in essential goods and services.
The annual average CPI between 2024 and 2025 are reflected below:
- Apparel and Upkeep: -0.13%
- Education and Communication: +0.46%
- Food and Beverages: +2.73%
- Housing: +3.75%
- Medical Care: +2.88%
- Recreation: +2.12%
- Transportation: +0.71%
- Other Goods and Services: +3.60%
- All Items (Composite Index): +2.63%
The average annual composite CPI increased by 2.63% between 2024 and 2025. The largest contributors to overall inflation were Housing and Other Goods and Services, each rising by over 3%. Food and Medical Care also added significantly to inflation, with increases above 2.5%. In contrast, Apparel and Upkeep, Education and Communication, and Transportation experienced more modest changes.