The Number of Building Permits Decrease by 15% in the Capital Region Between 2024 and 2025
In the 2025 U.S. Census Building Permit Survey, the Capital Region experienced a 15% decline in total permits, decreasing from 2,366 in 2024 to 2,011 in 2025. Examining building permit activity over time, the region has an average of 2,168 permits issued per year, with a standard deviation of 532. This relatively large variation indicates that annual totals fluctuate significantly around the average. Typically, yearly totals range between approximately 1,636 and 2,700 permits, highlighting the volatility in building activity. Part of this volatility may stem from how the U.S. Census collects building permit data. Permit counts depend on accurate reporting from municipalities, and incomplete reporting can create apparent undercounts. Moreover, not all permitted projects are constructed, factors such as funding delays, changes in project plans, or regulatory hurdles can delay or cancel developments, further complicating the interpretation of permit trends.
About the Data:
The U.S. Census Building Permit Survey records permits by number of units and buildings. For example:
- A permit for a single-family home counts as a 1 building and 1 unit structure.
- Multi-family structures are categorized by size:
- 2-unit buildings
- 3-4 unit buildings
- 5 or more unit buildings
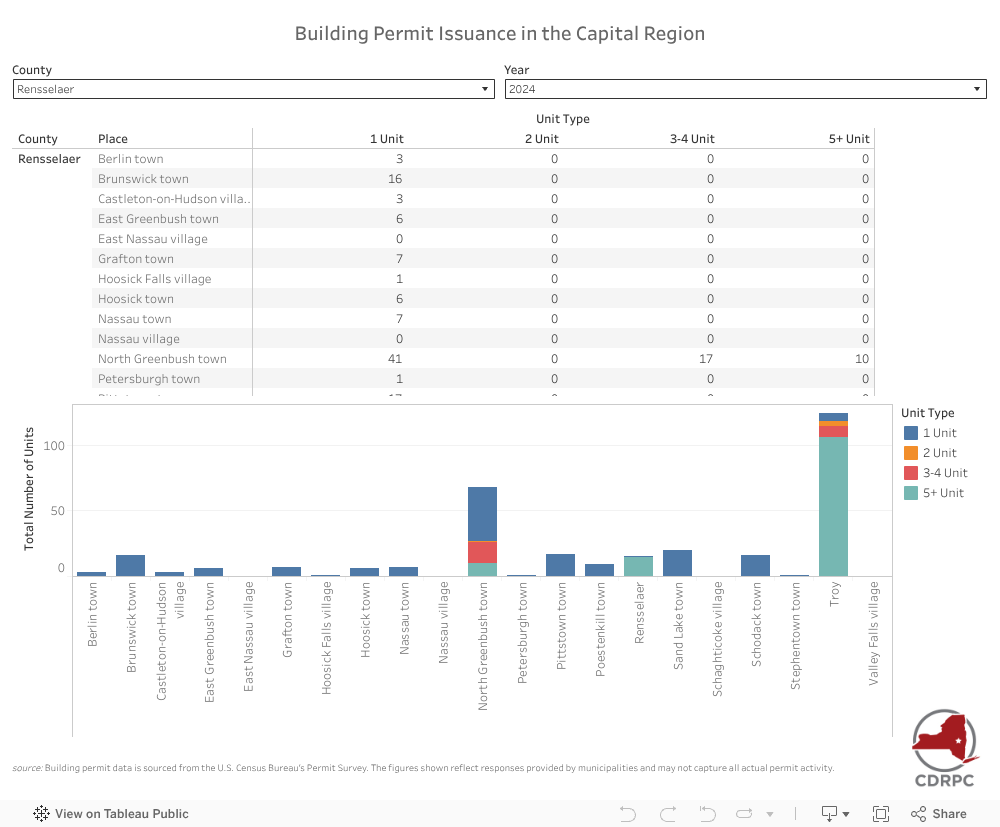
Each category provides separate values for the number of buildings and the number of units. In this article, the number of permits refers to the total number of units for which a building permit was issued. Explore the data visualization below to learn more about building permit issuances by municipality:
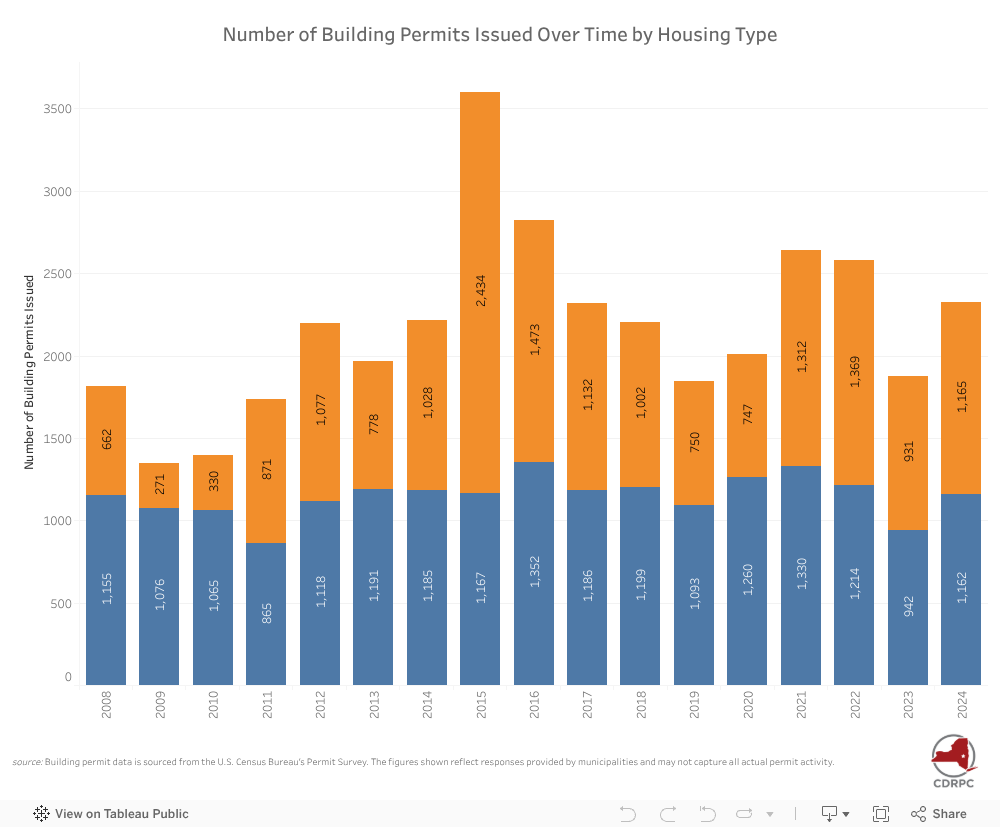
Single-Family Vs. Multi-Family Development
Between 2024 and 2025, the Capital Region saw a decline in multi-family permits alongside a modest increase in single-family permits. Multi-family permits fell from 1,209 in 2024 to 772 in 2025, a decrease of 437 units (-36%), while single-family permits rose from 1,157 to 1,239, an increase of 82 units (7%). After many years of multi-family permits exceeding 900 units annually, the 2025 total of 772 units represents the lowest number of building permits issued since 2020, resembling the levels observed in 2019 and 2020.
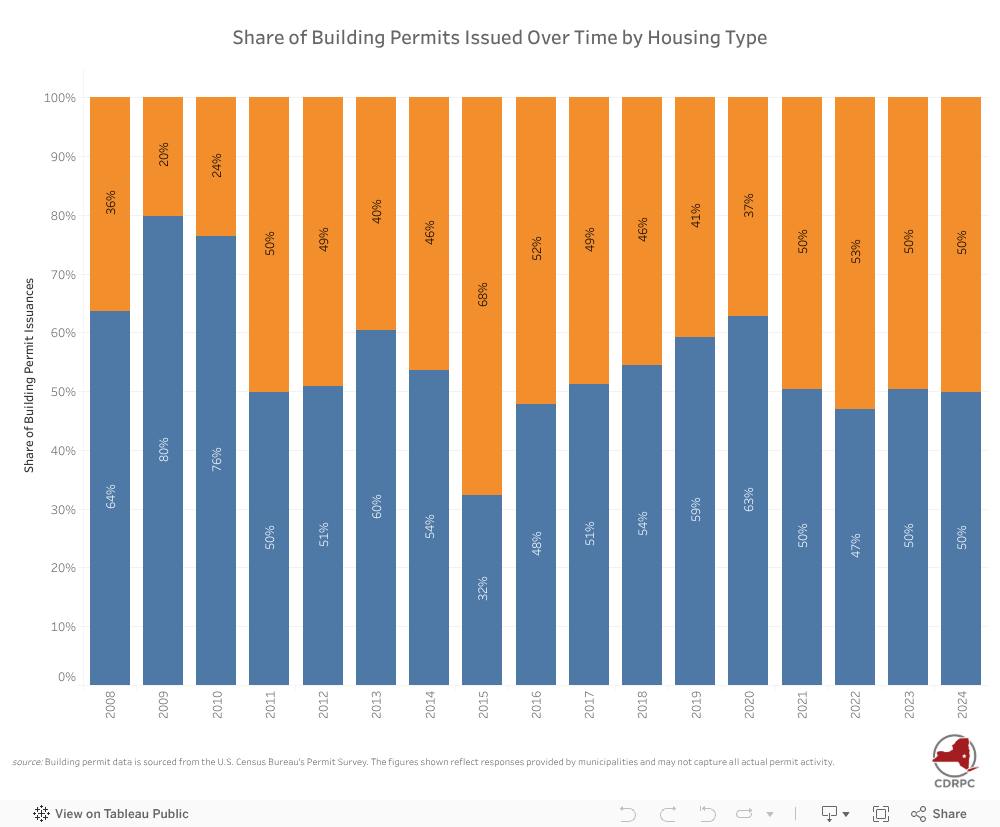
Share of Building Permit Type
In 2025, the Capital Region saw a much higher share of building permits issued for single-family homes, which accounted for 62% of all permits, while multi-family permits represented only 38%. This marks a notable shift from the past four years (2021-2024), when permit type allocation was closer to a 50/50 split. The 2025 pattern more closely resembles the period from 2018 to 2020, when single-family homes consistently made up well over half of all permits issued.
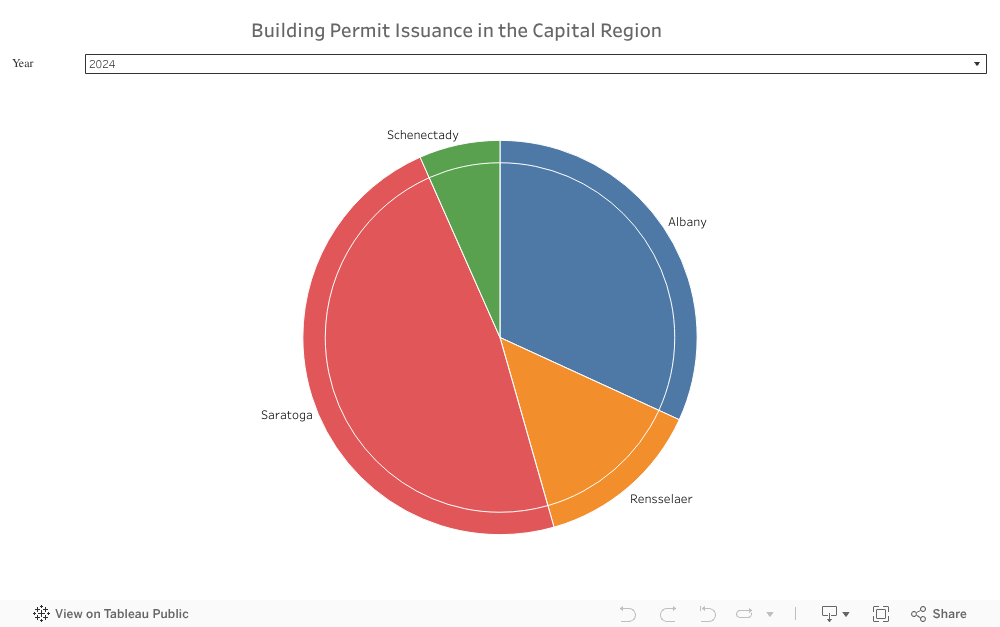
Breakdown by County
In 2025, the Capital Region issued a total of 2,011 building permits across Albany, Rensselaer, Saratoga, and Schenectady counties. The distribution varied across the region, with Saratoga County holding the largest share at 44% of total permits. Notably, 92% of Saratoga’s permits were for single-family homes, while only 8% were for multi-family units. This share has remained relatively consistent compared to 2023 and 2024, highlighting Saratoga’s dominant role in the regional housing market.
Albany County accounted for 34% of the region’s permits, with a strong focus on multi-family housing, 72% of permits were multi-family and 28% single-family, almost identical to last year’s pattern.
Rensselaer County issued 17% of all permits, maintaining an almost 50/50 split between single-family and multi-family units for the second consecutive year, reflecting a continued diversification of housing types.
Schenectady County made up the remaining 5% of permits, a 2% decrease in the share from 2024. The county showed a higher proportion of single-family permits than last year, with 60% single-family and 40% multi-family units.
Building Permit Issuance Municipal Map
In 2025, the top five municipalities in the Capital Region for building permit issuances were led by City of Albany, which issued an 354 permits. Followed by the Town of Wilton with 173 permits, while the City of Troy ranked third with 157 permits issued. Saratoga Springs and the Town of Halfmoon rounded out the top five, with 131 and 130 permits. These municipalities highlight the significant construction activity occurring across the region, contributing to its ongoing growth and development.