NAICS Employment Comparison 2000-2018
Health Care and STEM Jobs See Growth Since 2000
New York State has not only of the largest economies in the United States but one of the largest economies in the world. The New York State’s economy is the third-largest in the United States and with a GDP of over $1.5 trillion in 2017, was almost as large as the entire country of Canada’s economic output (Business Insider, 2019). A key barometer to measure an economy is by analyzing industry employment and business trends. Governments, planners, and other officials can utilize employment data to better tailor policy and programs to fit the needs of their state, county, or municipalities’ employment trends and the economy overall.
A detailed analysis of employment data and business trends can be done with the use of the North American Industry Classification System (NAICS) codes. NAICS codes are the classification used by the U.S. Federal Government and the U.S. Census Bureau to track and classify different business establishments into unique categories based on the primary business activity of that establishment. You can learn more about the NAICS code system and its history here. Utilizing NAICS code data from 2000-2018, we will take a look at trends is sector employment over this time and how employment has changed or has stayed the same.
Overall, Health Care and Social Service industry jobs have seen the largest increase in the region over the past two decades. This mirrors a trend seen throughout the United States over this time period, with Health Care and Social Services becoming the industry that employs the most people. Employment in STEM fields have seen gradual improvements since 2000.These improvements have built a strong base of employment in the region with the potential to add more jobs in the coming decade.
New York State
2000
Starting off in 2000, New York State had 572,696 employment establishments across the state with 8,471,278 employed workers.
In 2000 New York State’s employment was largely fueled by governmental and administrative jobs as well as the other biggest industries across the country. Since the decline of traditional manufacturing in the United States, Health Care and Social Services has become one of the largest industries across the country. However, the manufacturing of technology and other electronics is still an important facet of a modern economy. In 2017, Health Care and Social Assistance employed by far the most people in the United States with 21,632,434 employees in the industry, 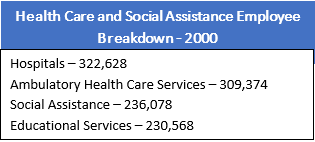 approximately 14% of all employment in the country. This trend holds true for New York State with the largest number of employees working in this sector. However, the prevalence of local government and administrative jobs may not be as common across the country as it is in New York. New York is a home rule state, meaning that local governments serve an important role in the daily workings of municipalities.
Retail trade, Accommodation and Food Services, and Food Services and Drinking Places are huge parts of any economy and typically employ many people as it does in New York State. There are typically many establishments and often do not require high skill work to be hired, making jobs accessible to most people.
Finance and Insurance and Professional and Technical Services are higher-skill jobs that are typically more lucrative, and in this case, have higher average annual salaries than all the other industries in the top 10. These jobs being in the top 10 are a good sign for an economy, showing the diverse employment that is available across New York State.
2018
Between 2000 and 2018, New York has seen many changes in its economy, leadership, and makeup. A more concentrated effort on revitalizing upstate has been put in place with an attempt to create more opportunities for Science, Technology, Engineering, and Mathematics (STEM) employment and education. By 2018, New York State saw an increase in both business establishments and overall employees. Business establishments increased to 639,811 and there were 9,431,239 employees across all industries.
While Health and Social Assistance still has the most employees, it has now overtaken the combination of all government jobs. The top 10 industries have remained relatively the same since 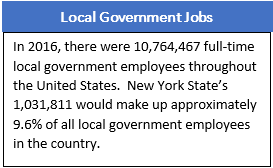 2000, except for the inclusion of Ambulatory Health Care Services, which in 2000 employed 309,374 people. Health Care and Social Assistance saw the largest increase of all the industries with 487,887 more employees and 12,396 more establishments in 2018.
Manufacturing fell out of the top 10 industries, showing the overall decline of the industry over the past 18 years. The Manufacturing code covers a wide range of products, from grain and oilseed milling to burial casket manufacturing. The manufacturing code is comprised mainly of establishments “transform” raw materials or components into new products. While there are still goods manufactured in the United States, outsourcing manufacturing to other countries has become a widespread trend over the past few decades.
Professional and Technical Services growth is a good barometer to determine if New York’s STEM initiatives are working. Between 2000 and 2018, the industry has added 127,217 employees and 13,772 new establishments to the state.
Capital Region
Data at the state level gives an overall look at New York’s economy, but how does that compare to the economy of the Capital Region? With economic initiatives of its own, has the Capital Region seen similar growth? The NYS Department of Labor collects data for the Greater Capital Region area including Albany, Columbia, Greene, Rensselaer, Saratoga, Schenectady, Warren, and Washington counties.
The Capital Region, in an effort to revitalize upstate, prevent brain drain, and stimulate the economy, has made an effort to establish itself as a hub for Professional and Technical Service Jobs. The Capital Region has been working to attract STEM businesses and create opportunities for workers to gain the necessary education to fill those jobs with branding and policy efforts. Bringing in SUNY Polytechnic (LINK) and Global Foundries (LINK) are two examples of these efforts to attract and grow STEM opportunities in the region. Looking at the data from 2000 and 2018 can provide a look into the effectiveness of these efforts.
While the Professional and Technical Services does not perfectly encapsulate all the areas of STEM jobs and includes non-STEM areas such as legal services. However, this industry code does cover scientific research and development as well as other important aspects of the STEM initiative, so we will be using it as a barometer to measure the industry. There are also aspects of STEM in Manufacturing and other industry codes, but we will be using the Professional and Technical Services industry code as it covers the research development, and management and other services of STEM work.
2000
In 2000, the Capital Region had a combined 26,373 establishments and 492,492 employees.
Similar to New York State, Health Care and Social Assistance is the largest industry in terms of the number of people it employs. Retail Trade and Local Government also appear in the top 5 industries as they did for the State overall. Unlike the rest of New York, the Capital Region had a high number of state government jobs. With Albany being at the heart of the region, the state government is a major employment hub for the region and draws in employees from the surrounding areas.
Outside of state government, the rest of the top industries in the region were like the rest of the state’s employment makeup. Manufacturing, food, and administrative services were amongst the largest employment industries for the region just as they were for the state. Professional and Technical Services had 2,933 establishments and employed 31,689. Using these figures as a base, we can evaluate the progress of STEM-focused efforts.
2018
In 2018 the Capital Region had 29,902 establishments and 529,095, both increases from 2000. There were slight shifts in the top industries in the region over the time, but they remained mostly the same from 2000.
Between 2000 and 2018, some of the top industries in the region saw slight declines, while others saw large increases. Health Care and Social Assistance saw a large increase, with only 341 establishments added but 17,485 employees added over that time, the largest of all the industries. Accommodation and Food Services and Food Services and Drinking Places also saw 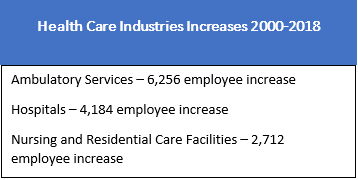 significant increases in this time, with Accommodation and Food Services seeing over 12,000 employees added at this time. Ambulatory Health Care Services and Hospitals made jumps into the top industries in the region, showing the ever-expanding importance of health care and related services has on the economy of the region.
Retail Trade, Local Government, and State Government all saw employment declines since 2000 but still maintained enough employees to be in the top 5 biggest industries in the region. State government saw the largest employment decrease with 3,424 fewer employees through 2018. However, these industries saw overall increases during this time in New York State. Though traditional retail is shrinking, with traditional brick and mortar stores finding it more difficult to keep up, online retail is constantly growing with more and more people doing their shopping online.
Professional and Technical services did see moderate growth in the region. The industry added 389 establishments and 4,976 employees over time. While other top industries have been declining slightly, Professional and Technical Services have seen growth in this time which is a positive sign for the region’s STEM efforts. However, the industry has still not seen growth at the rates that food and health care have seen, this growth is a strong base for future development in the region.
Averaging the past 19 years of data together, Health Care and Social Assistance employed an average of 70,432, the most of any industry. This was followed by Retail Trade, Local Government, and State Government. Professional and Technical Services averaged 29,798 employees over the past 19 years, greater than 2000’s total and a sign of growth over time.
Albany, Rensselaer, Saratoga, and Schenectady Counties
How does employment from the four core counties of the Capital Region make up the region’s employment? Each county has its own unique part to play in attracting businesses, creating employment, and being a part of the regional identity. With the prevalence of Health Care and Social Services and the push for more Professional and Technical Services, we will be taking a look at the
Albany County
Albany County’s biggest industry is State government, which is no surprise due to the fact that New York State’s government is based in the City of Albany, with an average of 42,894 employees per year. The next highest average employer is also no surprise, with the Health Care and Social Assistance industry employing an average of 29,749 employees over the past 19 years. This is an average of 7,000 more employees than the next closest industry, Retail Trade.
Albany County has the largest concentration of Professional and Technical Services employment. Professional and Technical Services employs an average of 14,602 people per year, approximately 6.3% of all employment in the county. While obviously not as high as health care, this was the fourth highest average industry and only 1,000 less employees than the next highest industry, Local Government. In 2000, the industry employed 12,966 people from 998 establishments, which increased to 15,339 employees from 1,249 establishments. This is a strong sign of growth of the industry in Albany County. While there are many factors that have likely led to this growth, one of the largest factors has been the SUNY Polytechnic Campus which has attracted STEM jobs and opportunities to the county.
Rensselaer County
With an average of 50,906 employees per year, Rensselaer County’s largest employer was Local Government with an average of 9,009 employees over the past 19 years. This was followed by Health Care and Social Services with an average of 8,401 employees per year. These are the two largest industries on average by at least 2,500 employees over the next closet industry.
Professional and Technical Services is less prevalent of an industry in Rensselaer County than in the other three counties. On average, this industry employs 2,197 people per year, the 12th most in the county. This makes up approximately 4.3% of all employment in the county. In 2000, The industry employed 2,498 with 292 establishments. By 2018, this had decreased to 2,173 employees across 276 establishments. Rensselaer is home to Regeneron, a strong hub for STEM jobs and economic opportunities, as well as great STEM academic institutions including RPI and the University at Albany Health Science Campus. Regeneron recently announced an $800 million expansion that anticipates increasing the number of local employees to over 4,000.
Saratoga County
Saratoga County has an average of 76,313 employees per year with Retail Trade and Local Government being the two biggest industries with an average of 11,065 and 9,694 employees respectively. With the ever-popular Saratoga Spring’s and Saratoga Performing Arts Center’s yearly tourism draws, Retail Trade is a huge economic strength for the county with people coming and shopping year-round. Health Care and Social Assistance followed closely with an average of 8,015 employees.
Saratoga County has seen growth in the Professional and Technical Services industry. The county has average employment of 4,128 people over the past 19 years, accounting for approximately 6.4% of all employment in the county. Starting in 2000 with 3,381 employees and 497 establishments in the industry, those figures grew to 5,445 employees over 677 establishments. Recently celebrating 10 years in Malta, GlobalFoundries has been a huge STEM industry hub for the county. GlobalFoundries has a huge impact on employment and attracting other STEM businesses and researchers to the region.
Schenectady County
With a yearly average of 63,291 employees, Schenectady County’s largest industry is Health Care and Social Assistance with 11,361 average employees, followed by Local Government with 7,618 and Retail Trade with 7,484. Schenectady County has the highest number of Health Care and Social Assistance jobs, showing that they are moving along well with the overall trend of the State. The new Rivers Casino will likely help bolster retail jobs over the next few years.
Professional and Technical Services are embedded in the DNA of Schenectady County with the establishment of General Electric in the county in the early 1900s. That base is still strong today as Schenectady has the second most jobs in the industry amongst the four counties. Average employment in Professional and Technical Services is 6,495, accounting for approximately 12.3% of the county’s employment. Starting in 2000, the county saw 5,718 employees in the industry over 297 establishments. This increased to 6,400 employees over 289 establishments in 2018. While GE employment has declined over the years, the county has been able to attract new businesses to help mitigate declines in GE employment.
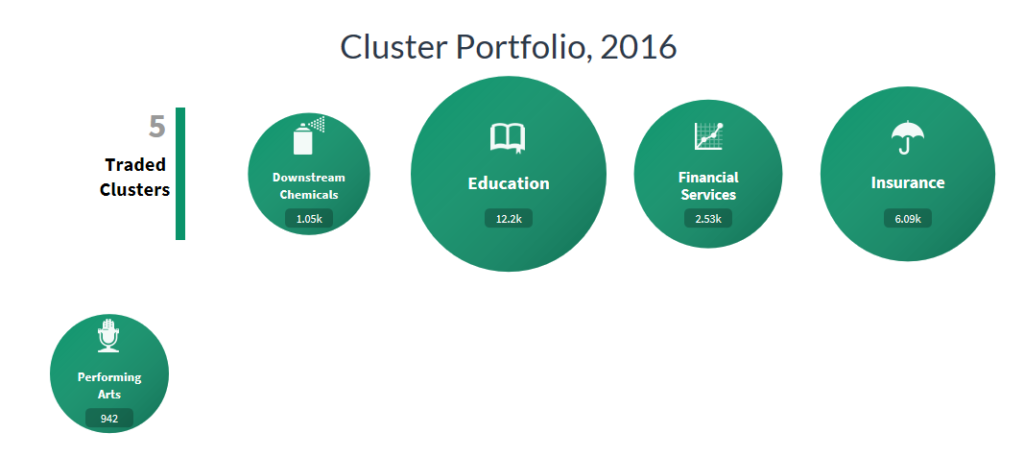
Cluster Mapping
U.S. Cluster Mapping is an online tool that helps identify focused clusters of employment across the United States. While the clusters defined by this tool do not always match the NAICS Codes classifications, they give a look into the overall regional economy and what industries are prevalent.
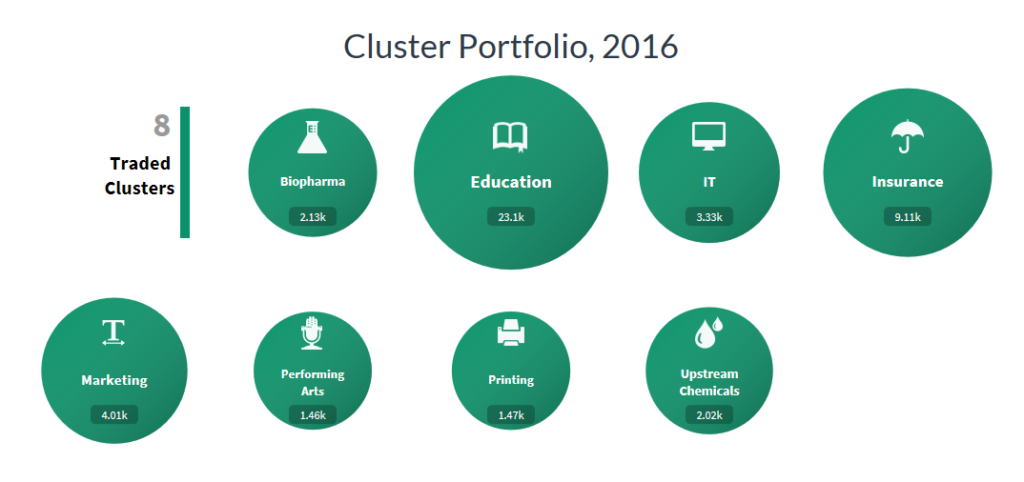
In the Capital Region, Education is the largest cluster based on employment. In this classification, Education includes Universities as well as research and professional organizations. The Education cluster employs approximately 23.1 thousand people throughout the region. The second largest cluster, Insurance, includes all facets of insurance including medical and health related insurance companies, fitting into the Health Care and Social Assistance NAICS Code industry. Another positive sign for STEM jobs is the presence of IT, Biopharma, and Upstream Chemicals as significant clusters in the region, showing growth in the field and backing the data seen in the NAICS codes.
Job Creation by County
U.S. Cluster Mapping also provides data on county cluster growth. This data shows how different clusters have created or lost jobs between 2000 and 2016 (the most recently available data). This growth or loss is compared to an expected rate of growth based on how the clusters have changed throughout the rest of the country. The expected rate of growth helps to show the potential for future growth by showing cluster trends and compare the progress of local clusters to their progress throughout the rest of the country.
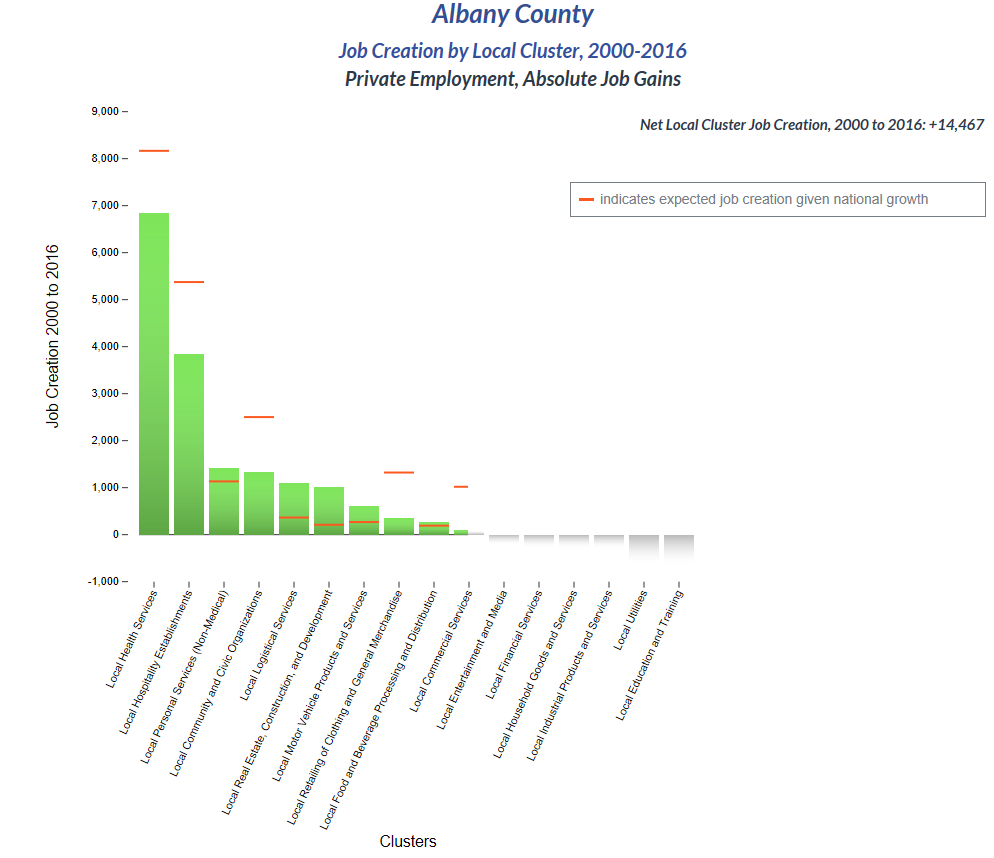
Between 2000 and 2016, Albany and Saratoga saw the most net job creation with over 14,000 and 11,000 jobs created respectively. Local Hospitality Establishments and Local Health Services created the highest numbers of jobs across the four counties, with the highest single county total occurring in Albany with almost 7,000 Local Health Services jobs created.
Albany County
Of all the local clusters in Albany County, Local Health Services saw the highest growth, reflecting the NAICS Code analysis. Expected growth was higher than the actual growth in the county, but this is understandable with the huge boom the industry has seen throughout the country in the past two decades. Local Hospitality Establishments, which includes hotels, sports and concert venues, museums, and more, has also seen significant growth over the past two decades.
Local Education and Training on the hand, saw the most lost over the past two decades. With an expected growth of approximately 1,000 employees, this is a cluster the county can improve upon, especially with such a high concentration of the Education cluster in the region. Local Financial Services also saw a decrease which was the only other cluster that was expected to grow but did not in the county.
Rensselaer County
Rensselaer saw the highest cluster growth in Local Hospitality Establishments which saw almost 2,000 employees added. This outpaced the expected growth by over 500 employees. Local Health Services saw the second highest growth among clusters with over 1,000 employees added. Education and biopharma remain the two largest clusters in the county.
Local utilities saw the greatest loss over the past two decades with over 1,000 employees lost. Loss in this cluster was expected based on national trends, but the actual losses outpaced expected losses by over 500 employees. Local Community and Civic Organizations were expected to see growth over 500 employees but saw a loss of approximately 200 employees.


Saratoga County
In Saratoga County, Hospitality, Real Estate, and Health Services all saw the most growth with Hospitality and Real Estate far outpacing expected growth. Hospitality added over 4,000 employees and Real Estate added almost 2,500 employees. More than half of the clusters that were expected to grow outpaced expectations. Education, IT, and Insurance remain the largest clusters in the county.
Motor Vehicle Products and Services saw the largest decrease with over 500 employees lost, despite expected growth in the cluster. Utilities and Entertainment / Media both saw decreases along expected paths.


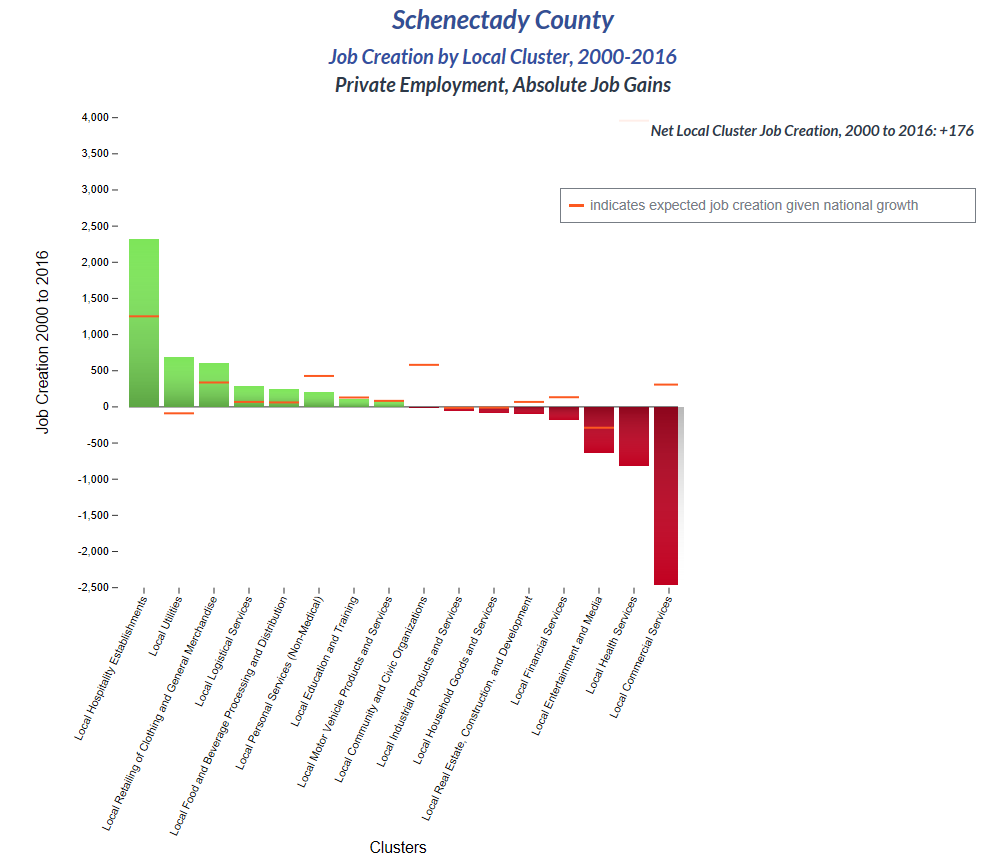
Schenectady County
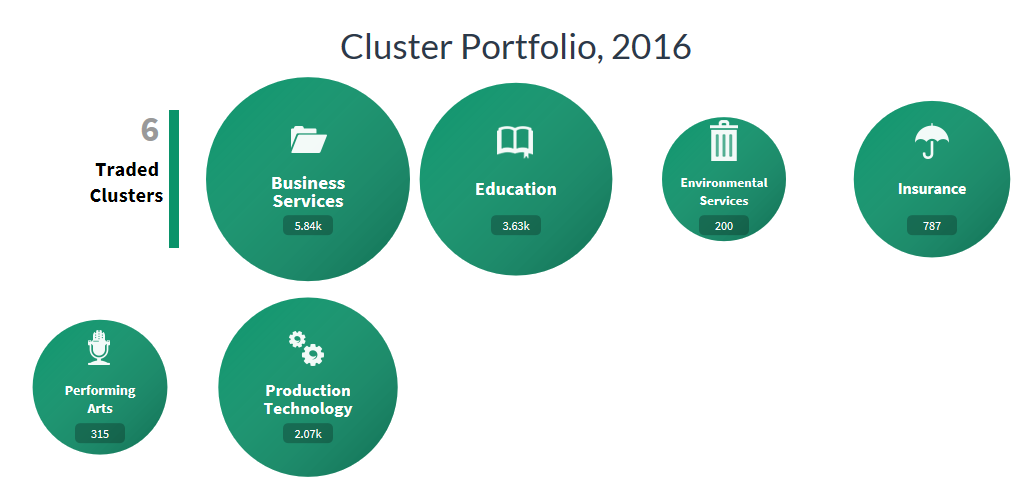
Hospitality by far saw the highest rate of growth in Schenectady County, adding almost 2,500 employees which outpaced expected growth. Utilities also saw growth despite expected declines in the cluster. Business Services and Education were the two largest clusters in the county, employing over 9,000 people combined.
Commercial Services saw a large decrease of approximately 2,500 employees despite expected growth. Health Services also saw a decline in the county despite being such a large and growing industry throughout the rest of the country.