Regional Building Permits Remained Stable in 2017
Regional housing market shows continued stability through building permits; demand for multi-family units remains strong
The 2017 Census Building Permits data are now available from CDRPC. The data continues to show both short-term and long-term trends in new residential development. Over the short-term, building activity has stabilized, and permits for multi-family units now account for half of new construction. Over the long-term, however, total building permits continue to decline. Permits for single-family units in 2017 accounted for 30% of what they were in 1986.
Total Building Permits
Total building activity reached an all-time high (since data was recorded) of more than 5,000 permits in 1986. However, by 1990, activity had fallen to fewer than 3,000, and eventually to 2,199 in 1997. The market did see a turn-around by the close of the millennium. New construction began to increase in 1999, and from 2002-2005 exceeded 3,000 units annually.
After 2005, the housing market suffered a downturn- falling to fewer than 1,400 permits in 2009 and 2010. Since then, the market has slowly recovered. New construction began to gradually increase in 2011 and has generally stabilized since 2012. In 2017, there were 2,318 permits issued for new residential construction. While this continued stabilization represents progress for the housing market, it is still well below levels from the early to mid-Aughts.
Shares of Building Permits
The composition of building permits continues to evolve. For much of the last 30+ years, the vast majority of new homes were the single-family variety. In 1986 alone, there were almost 4,000 permits issued for the construction of single-family homes. On average, from 1984 to 2005, almost 76% of all annual residential construction was for single-family homes. Seven times during that period, the share of single-family homes exceed 80%, with the highest share occurring in 1993 with more than 86%.

But in recent years, the composition has begun to change. In 2007 and 2008, construction of multi-family units increased sharply, exceeding 40% for the first time in 2007. In 2011, construction was split 50/50 between single-family and multi-family units. Growth continued and multi-family housing rose to reflect a 68% share of permitted units by 2015. For six of the last seven years, the share for multi-family units has exceeded 45%. In the year they did not, their share was almost 40% and would have been the second highest of all-time prior to 2011.
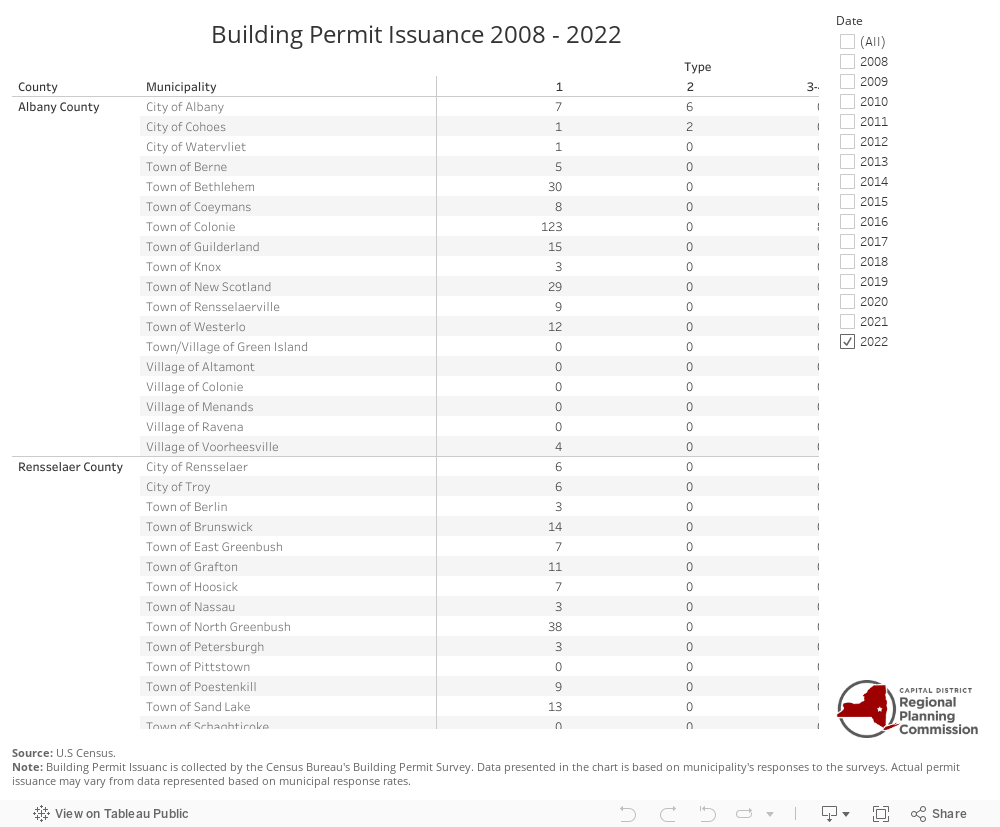
This data and more information about the region’s housing market can be found here on our website. You can find historical data for the region, counties, and all municipalities. You can also view the value of the permits, and see a detailed breakdown of permits for multi-family units.