Consumer and Producer Prices Indexes Increasing
The Consumer and the Producer Price Indexes (CPI & PPI) have both increased in the Region throughout 2022. The Composite Index, which measures the average of all of the CPI’s items, has risen by 14.8%, and the PPI has increased by 32.9% since the first quarter of 2019 – before the COVID-19 pandemic. After experiencing a dip in April 2020, the PPI has been experiencing a steady increase except the last quarter of 2021 where it fell by 0.6% and has risen again by 9.6% in April 2022.
The Cost of Living Index (COLI) measures relative affordability against the national average and allows for comparison to other areas. While consumer costs may be rising, a declining COLI composite index may show that costs in our region may not be rising as rapidly as in other regions. A detailed summary of CPI, PPI and COLI indices follows.
Consumer Price Index
The composite index of the CPI has been increasing since the beginning of 2019 with a faster rate during the pandemic. The composite index aggregates the eight items (Apparel and Upkeep, Education and Communication, Food and Beverages, Housing, Medical Care, Other Goods and Services, Recreation and Transportation) measured by the index and provides an overlook at how the prices on the consumer side are changing. The overall increase in consumer prices is most contributed by the transportation, food and beverages and medical care categories. Consumer price index in transportation has experienced the most increase by 31.1%, followed by the food and beverages category with 15.8% from the first quarter of 2019. The cost of apparel and upkeep, education and communication, and recreation categories have been stable since Q1 2019. Medical care cost has increased by 10.4% since the first quarter of 2019. The rate of increase has slowed from March to April 2022.
Producer Price Index
The producer price index (PPI) measures the average change over time in the selling prices received by domestic producers for their output. After experiencing a dip with 185.50 in April 2020, the PPI has been increasing in the region ever since where it reached 264.67 in April 2022.
Cost-of-Living Index (COLI) Has Decreased
The Composite Index, which serves as an aggregate of all the categories measures in the COLI Index, has decreased by 1.28% from the last quarter of 2021 (Q4 2021) to the first quarter of 2022 (Q1 2022). The index increased to 109.8 in the previous quarter after it had declined in each quarter following Q3 2020 where it reached a peak of 110.6.To compare the pre-pandemic period – Q1 2019 and Q1 2022, the composite index decreased from 109.2 to 108.4.
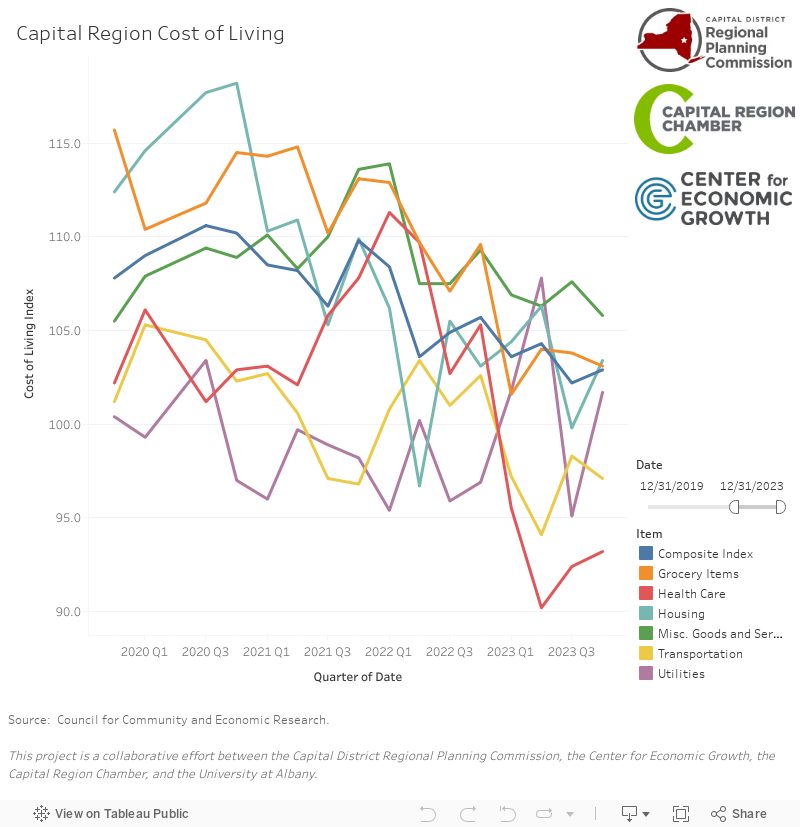
The cost of grocery items, housing and utilities have declined from the previous quarter Q4 2021. In Q3 2021, grocery items were at 110.2. After this quarter, the price jumped up to 113.1 in Q4 2021 and dropped to 112.9 in Q1 2022. Housing costs saw a steady decline after Q4 2020 when it has reached its lowest to 105.3 in Q3 2021 since 2011. In Q4 2021, it slightly increased to 109.9 and then dropped back to 106.2 in Q1 2022. Housing costs have experienced a 10.3% decrease since Q1 2019. The other categories experienced a decline since Q1 2019 are grocery items, utilities, and transportation with 4.9%, 1.9% and 4.8% decrease, respectively. Utility costs have been decreasing since Q3 2020 with an exception between Q1 2021 and Q2 2021 periods where it had an increase to 99.7 from 96.0. After Q2 2021, utility costs declined to 95.4 in Q1 2022.
Health care, transportation, and miscellaneous goods and services have increased since Q4 2021. Health care costs started at 107.8 in Q4 2021 but have since increased to 111.3 in Q1 2022. Miscellaneous goods and services have also increased slightly since Q4 2021 to 113.9 from 113.6. Transportation costs increased to 100.8 in Q1 2022 after it reached to its lowest level in Q4 2021.
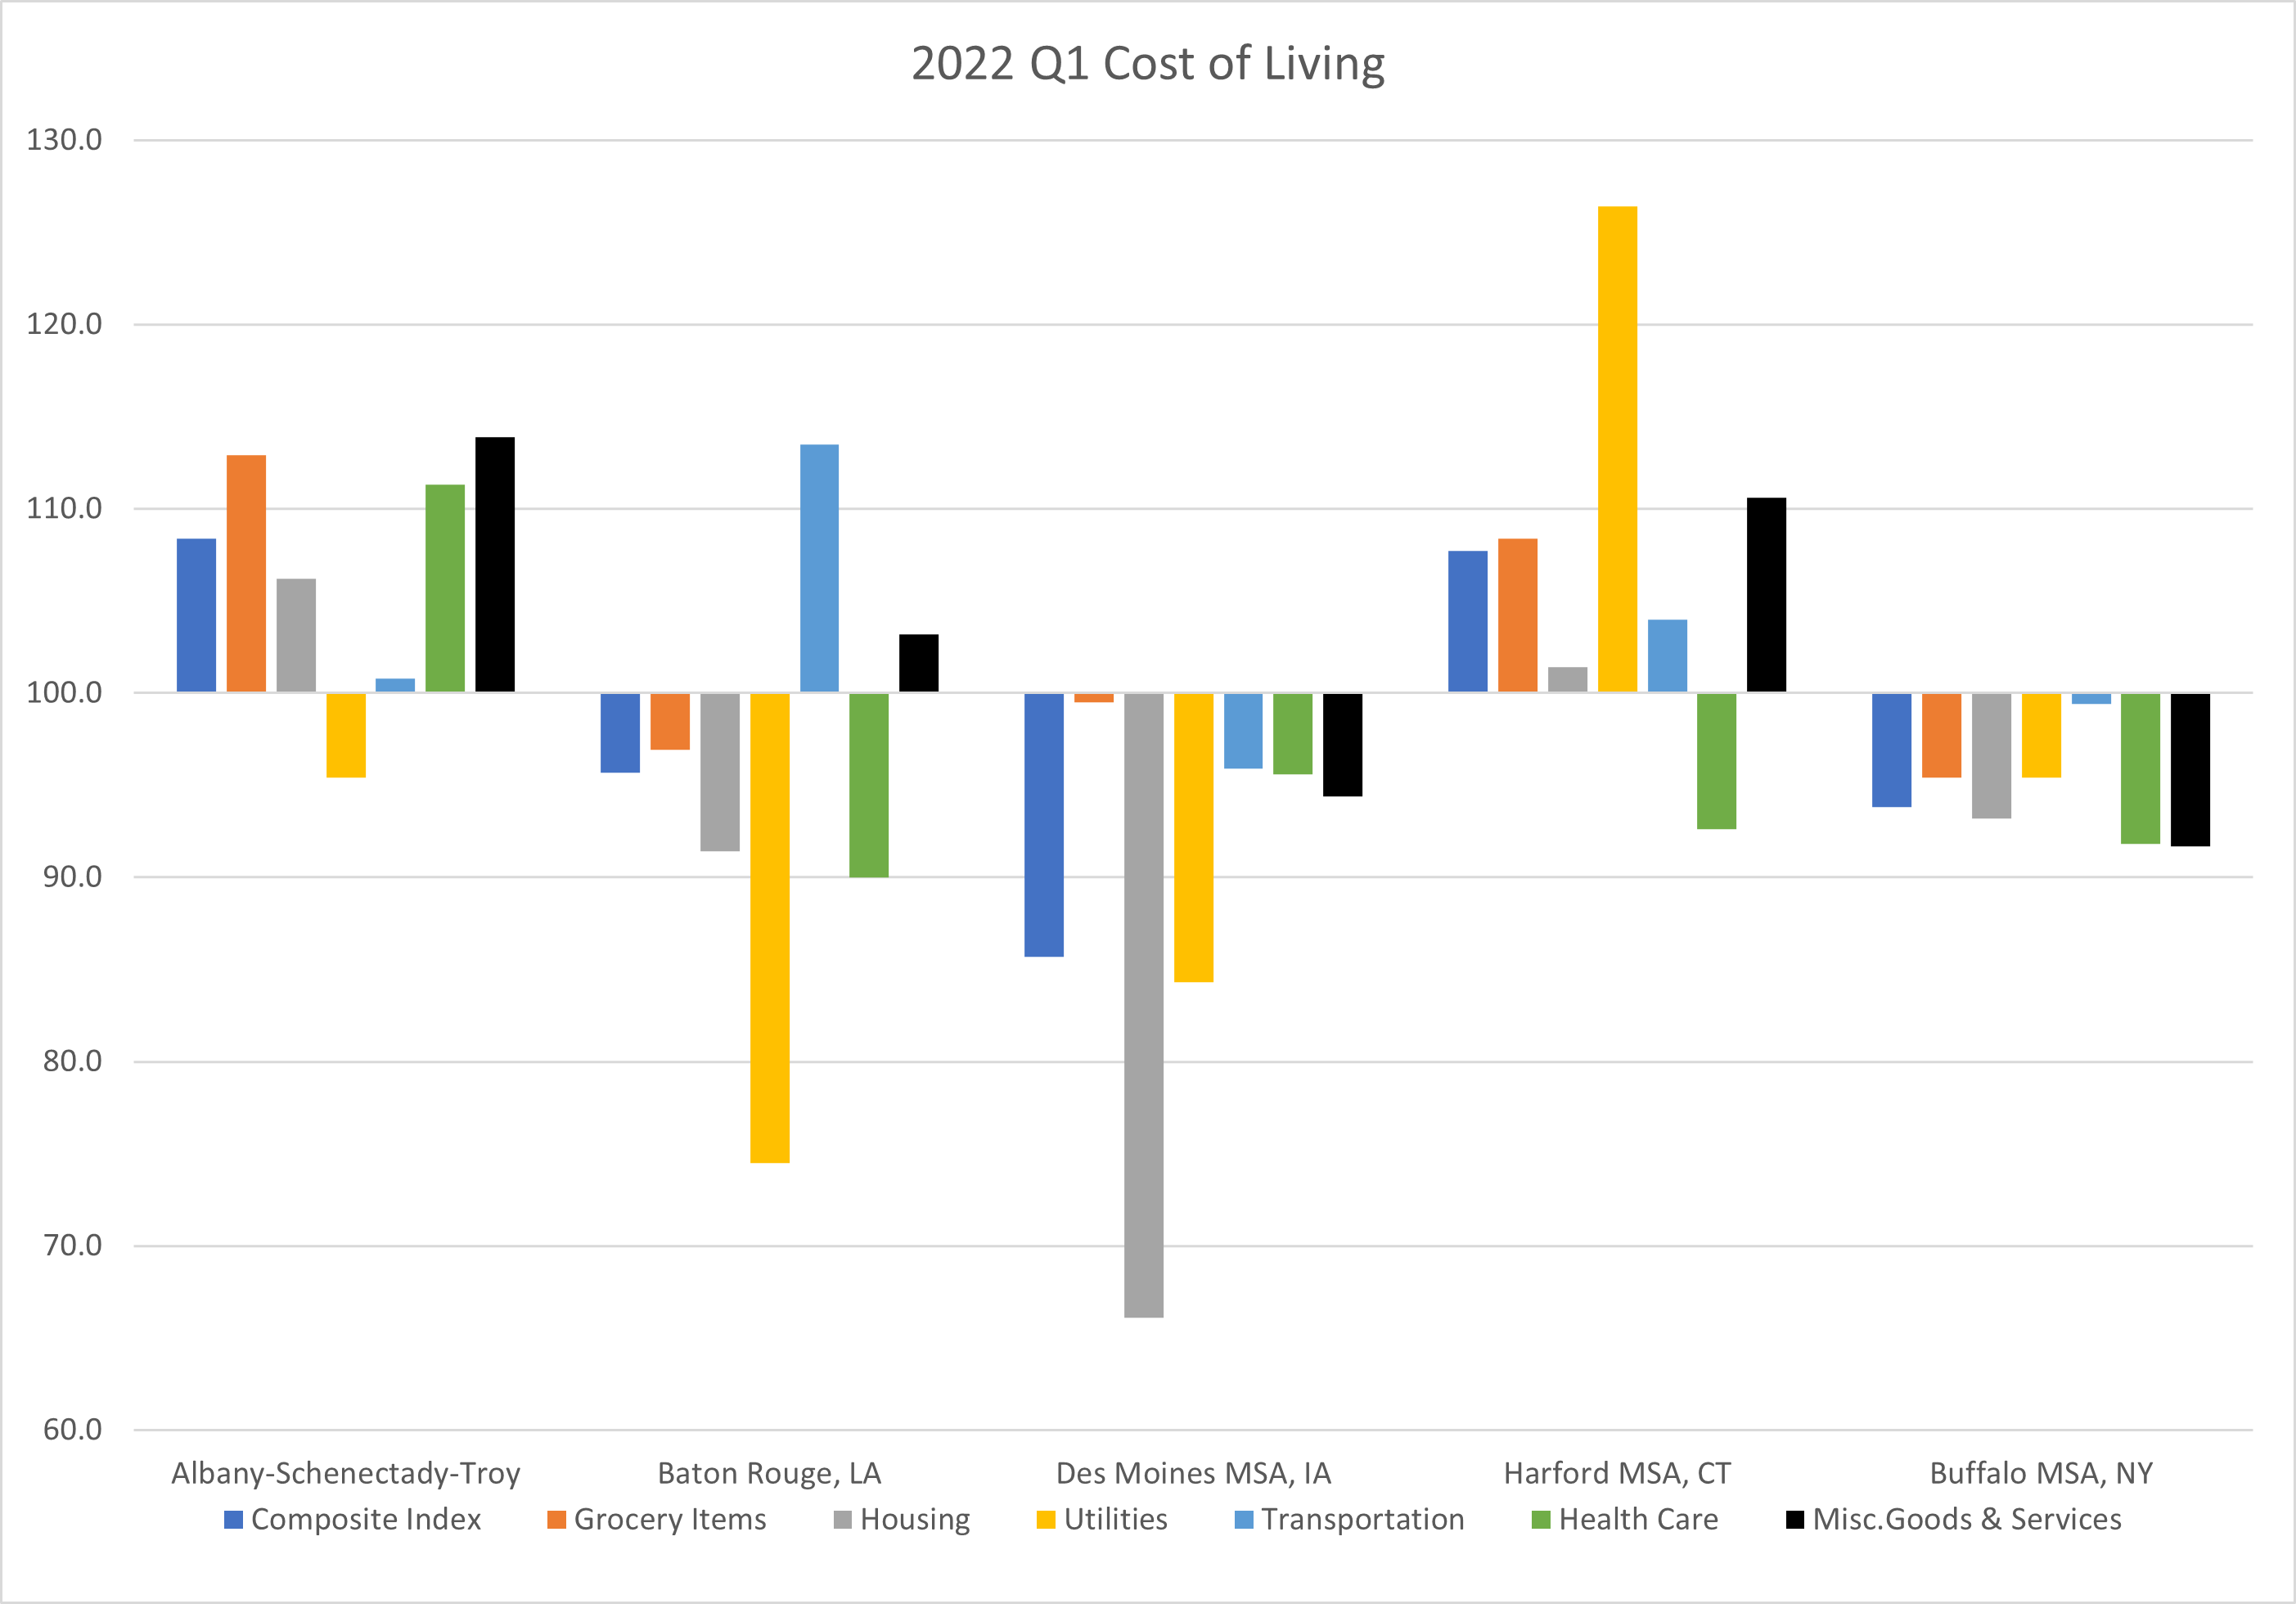
Comparison to Peer Communities
The majority of the selected peer communities across the country saw below the average cost of living across the indexes. Both Albany and Hartford MSA, CT saw majority of their indexes above the country average in Q1 2022. Hartford’s Utilities Index was the highest of all the peer communities. Albany saw the highest Composite Index, indexes for Grocery Items, Health Care, Misc. Goods and Services, Housing across the peer communities.
Des Moines MSA, IA and Buffalo, NY both saw all of their indexes below the national averages. Baton Rogue had both Transportation and Misc. Goods & Services costs above average, but largely below on Utilities and Health Care costs. Overall, Albany and Hartford both saw above the average composite index costs while Baton Rogue, Des Moines, and Buffalo saw below average Composite Indexes.
How to Use COLI Index?
Assume you are earning $44,000 after tax in Des Moines, IA, the comparable after-tax income in Hartford, CT is $55,875.43. If you move from Des Moines, IA to Hartford, CT groceries will cost 10.70% more, housing will cost 45.48% more, utilities will cost 43.20% more, transportation will cost 10.65% more, and health care will cost 1.25% more. To see how our region compares to others around the country, CDRPC makes available a Cost of Living Index Calculator below.