Regional Housing Market shows slight decline through building permits; demand for multi-family units declines
The 2018 Census Building Permits data are now available from CDRPC. This analysis is a continuation of last year’s DataNews post, which can be viewed here. Utilizing last year’s analysis and the current 2018 data, we can see a slight decline in overall building permit issuance and a decline in the share of multi family permits issued. In the short term, overall permit issuance and the share of multi family permits has continued a decline since a 15 year high in 2015. In the long term, permit issuance is still in line with the overall trend since 2012 and is relatively stable in that time. Permit issuance is still below the levels seen in the early 200s, but above the early 2010 years.
Total Building Permits
Total building permits have continued to decline since the 15 year high in 2015 with 2,137 permits issued in 2018, 181 fewer permits than 2017’s 2,318. While building permit issuance in the region was annually above 3,000 in the early 2000s it has reached above that figure only once since 2006. An outlier year in 2015 saw 3,601 building permits issued throughout the region. However, since 2012, the trend of permits hovered around 2,000 each year and this year’s total continues that trend.
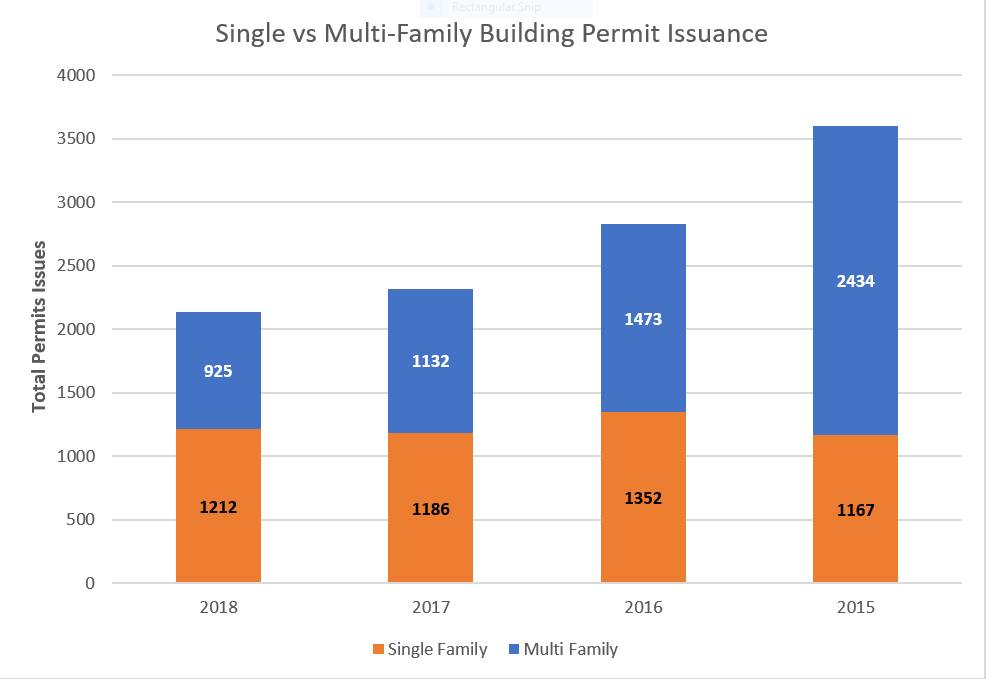
Shares of Building Permits
2018’s composition of building permits continues signs of changing short term trend of a higher volume of multi family permits being issued. Before 2011, multi family permits accounted for more than 40% of total permits once since 2002. Single family permits dominated the market between 2002 and 2010, however this began to shift in 2011 when multi family permits made up most total permits for the first time in 15 years throughout the region. Multi family permits hit a high of 67.6% of total permits issued in 2015 and have been declining ever since. In 2018, multi family permits made up only 43.3% of total permits issued, a drop from 2017’s 48.8% and a 2015’s 67.6%.

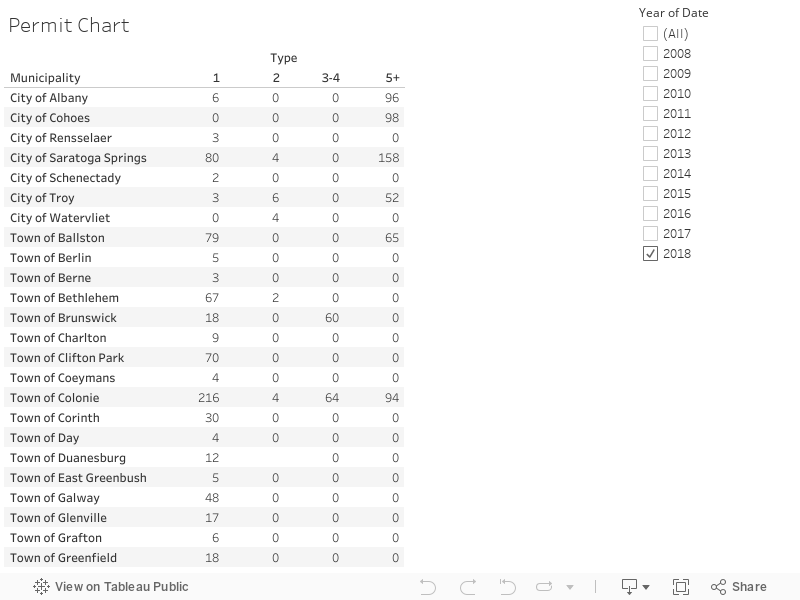
Permits by Municipality
While we know the total number of permits issues throughout the region, not all communities issue an equal number of permits. Across the region, some communities issue hundreds of permits each year and some communities do not issue any. From 2008 through 2018, Colonie issued by far the most permits, with 4,070 total permits issued, followed by Halfmoon (2,257), Saratoga Springs (1,522), Albany (1,204), and Bethlehem (1,202). For Colonie, Halfmoon, and Bethlehem, half or most of these permits were for single family residential units with 2,436 in Colonie, 1,446 in Halfmoon, and 604 in Bethlehem. Saratoga Springs and Albany saw a much higher rate of multi family permits issued with 1,045 in Saratoga Springs and 933 in Albany over ten years. These are the only communities that issued over 1,000 permits over the ten-year period, however many communities issued between 800 and 1,000 as well. Check out the map below for a look at other communities permit issuance.

In 2018, Colonie (380), Saratoga Springs (242) and Halfmoon (161) again saw the most permits issued, with Stillwater (146) and Guilderland (140) close behind. Of these communities, Colonie and Halfmoon saw the largest share of single family permits with 218 in Colonie and 159 in Halfmoon. Larger shares of multi family permits were seen in Saratoga Springs (162), Guilderland (108), and Stillwater (96). Ballston, Rotterdam, and Albany also issued over 100 total permits in 2018. For a detailed breakdown of each community’s permit issuance between 2008 and 2018, check out the table below.