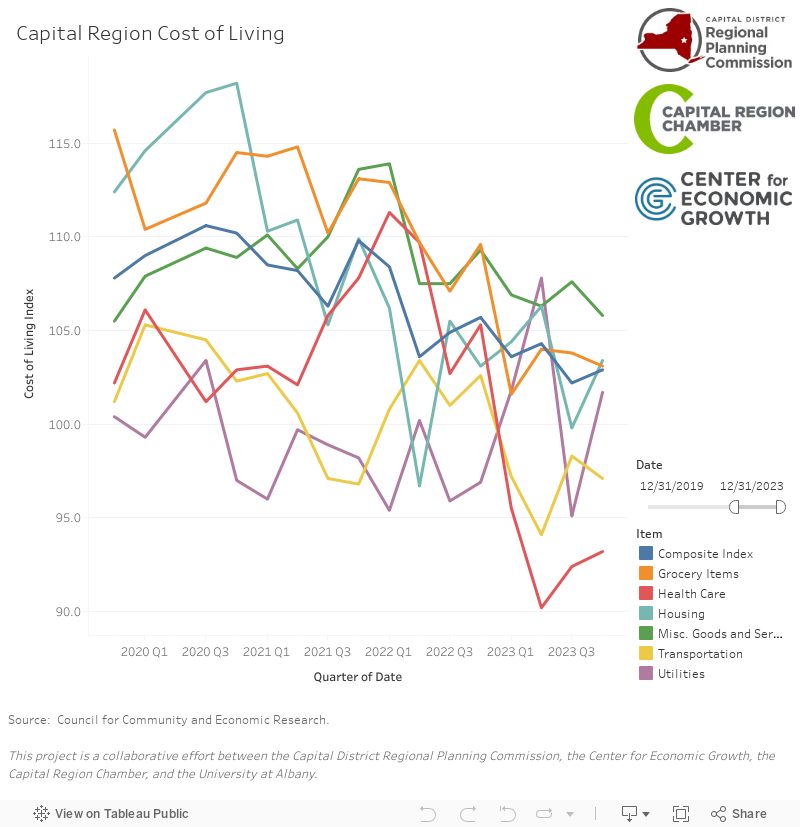
Cost of Living (COLI) in Albany-Schenectady-Troy MSA Remains Higher than Peer Communities
The Cost of Living Index (COLI) is a comparative tool used to show how expensive it is to live in one area relative to another, rather than a direct measure of how much prices have risen or fallen (for this measure see CPI/PPI). Each category, such as housing, groceries, transportation, or utilities, is expressed as an index, with 100 representing an average benchmark for the country. Values above or below 100 indicate whether costs are higher or lower relative to that benchmark. Because COLI is a normalized index, large numerical changes can sometimes reflect shifts in measurement or weighting rather than dramatic real-world price changes.
For example, a utility value changing from a small component number to a figure near 100 does not mean utility costs suddenly skyrocketed. Instead, it reflects a shift to an index that compares the area to a broader average. Because this measure is relative, an area’s index can increase even if actual utility costs go down, as long as costs in the surrounding or comparison areas fall by more.
COLI in 2025
Throughout 2025, utilities consistently remained below the national average, with an annual average index value of 96.85, indicating utility costs were 3.15% lower than average and relatively stable throughout the year. In contrast, most other cost categories recorded values above 100, the national benchmark, meaning that groceries (with the exception of the third quarter), healthcare, housing, miscellaneous goods and services, and transportation were all relatively more expensive in the Albany-Schenectady-Troy MSA than the U.S. average.
Across nearly all categories, the largest increase occurred in the third quarter of 2025. This midyear spike likely reflects seasonal and structural factors such as increased summer travel, back-to-school spending, and price adjustments made after evaluating first-half performance.
Housing remained the most consistently elevated category throughout the year, averaging 113.08 in 2025, approximately 13.08% higher than the national average cost of housing. The second most consistently above-average category was miscellaneous goods and services, which include personal care expenses (such as haircuts and dry cleaning), personal and professional services (including legal, financial, and accounting services), and everyday retail costs like repairs, maintenance, and membership fees. This category averaged 109.23 in 2025, or approximately 9.23% above the national average.
Peer to Peer Comparison
One of the benefits of the COLI index is that it allows for cross-regional comparisons. The Capital District Regional Planning Commission (CDRPC) previously identified peer communities in the 2015 Capital Region Indicators Report. These communities were selected based on the criteria that they are either within 40% of the Albany-Schenectady-Troy MSA’s population size or include a state capital.

Excluding Albany-Schenectady-Troy and Hartford, In Q4 2025, most peer communities experienced below-average numbers across most categories.
- Des Moines, IA, Baton Rouge, LA, and Buffalo, NY continued to record some of the lowest overall cost of living values, compared to other peer communities.
- Albany-Schenectady-Troy maintained COLI values above its peer communities in Q4, following similar trends over the past year.
- Hartford, CT remained an outlier in the Utilities category, reporting an index of approximately 126.7, the highest among peer metros and roughly 27% above the national average. This is likely driven in part by Connecticut’s heavy reliance on natural gas for electricity generation and New England’s limited pipeline capacity, which can amplify price volatility during peak demand periods (ISO New England).
- Housing costs in Des Moines, IA continued to be among the lowest, with an index of around 62.8 in Q4 2025.
- Utilities in Baton Rouge, LA remained significantly below average, with an index of around 72.0 in Q4 2025.
Overall, the Q4 2025 data indicate that Albany-Schenectady-Troy remains moderately more expensive than most of its identified peer metros, particularly when compared to Midwestern and Southern capitals with lower housing and utility costs.
When compared to other metropolitan areas across New York State, Albany-Schenectady-Troy ranks among the higher-cost regions outside of New York City. In Q4 2025, the Capital Region recorded an overall index of 107.7, higher than Utica-Rome (96.8), Buffalo (97.6), Rochester (102.2), Syracuse (103.7), and Oneonta (100.5).
Housing remains the primary driver of Albany’s higher index, at 113.6, exceeding most upstate metros, including Rochester (103.1) and Syracuse (111.5). While Albany’s utilities index (97.0) is generally in line with other upstate regions, its overall cost profile reflects elevated housing and services costs relative to much of the state outside the New York City metro area.
Unsurprisingly, New York City boroughs remain significant outliers. Manhattan’s overall index of 239.0, with housing at 511.3, illustrates the substantial cost differential between downstate and upstate regions, reinforcing that Albany occupies a middle position: more expensive than most upstate peers, yet far below the cost structure of the New York City metro area.
Explore NYS Data
Additional information on COLI can be found: