Regional Economic Resources Dashboard
CDRPC has compiled some of the most useful economic indicators for the region to help track and measure COVID-19’s impact and the region’s recovery. This resource page will continuously be updated with relevant data sources that help paint us understand the region’s progress.
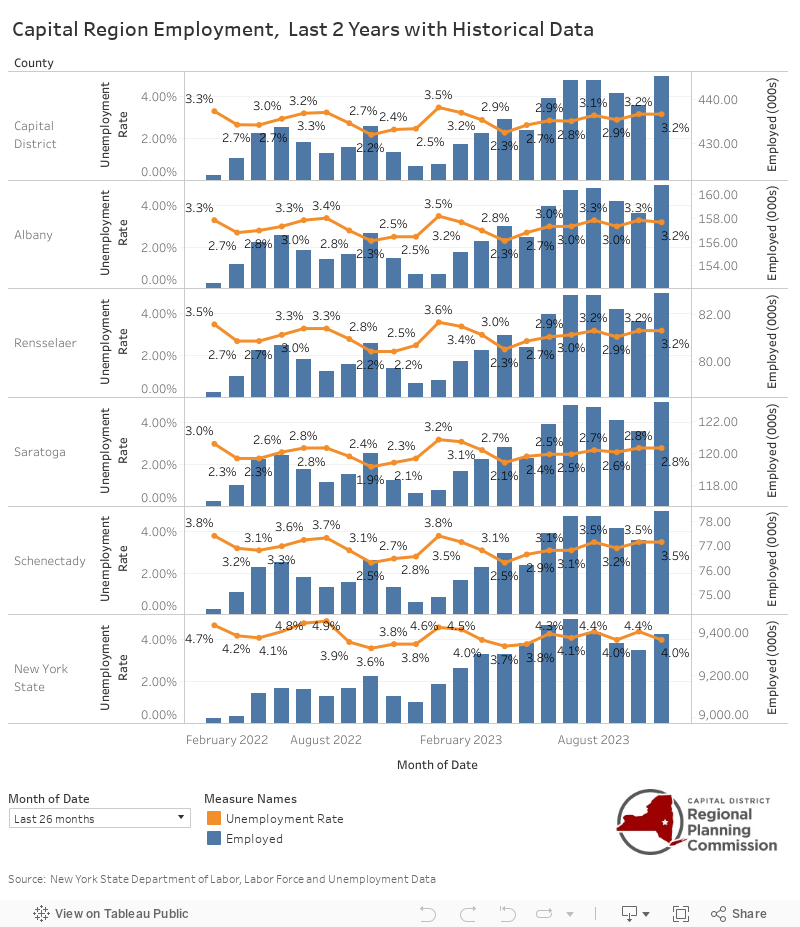
Employment
Employment statistics are the strongest economic indicator we can use. The number of people working typically directly correlates with the strength of an economy. COIVD-19 had a sever effect on the unemployment rate in the region, so continuously monitoring employment data can show the region’s progress towards recovery.
Monthly Unemployment Rate & Number of People Employed
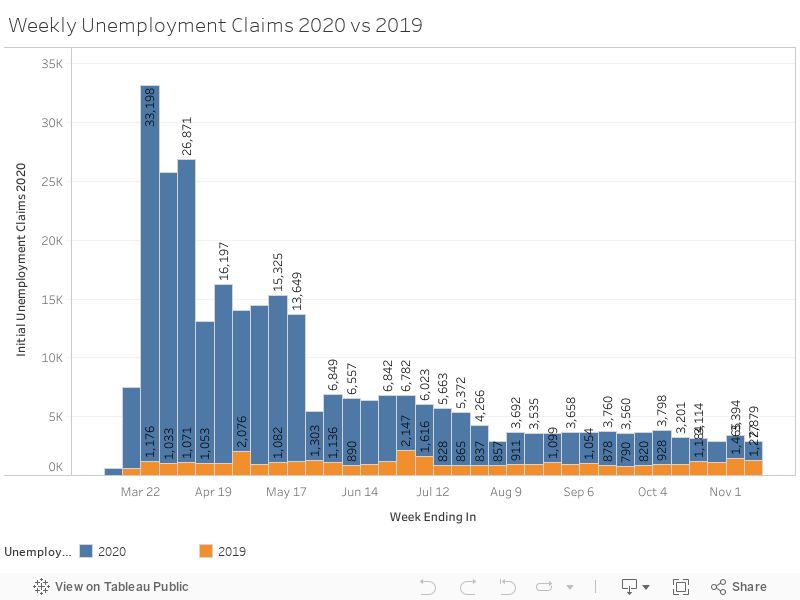
Weekly unemployment claims shows COVID-19’s impact on the economy in real time, showing the number of people who filed for unemployment in the region since the pandemic began. The data shows the weekly claims starting March 8th, 2020 and shows claims for the same periods in 2019.
Weekly Unemployment Claims
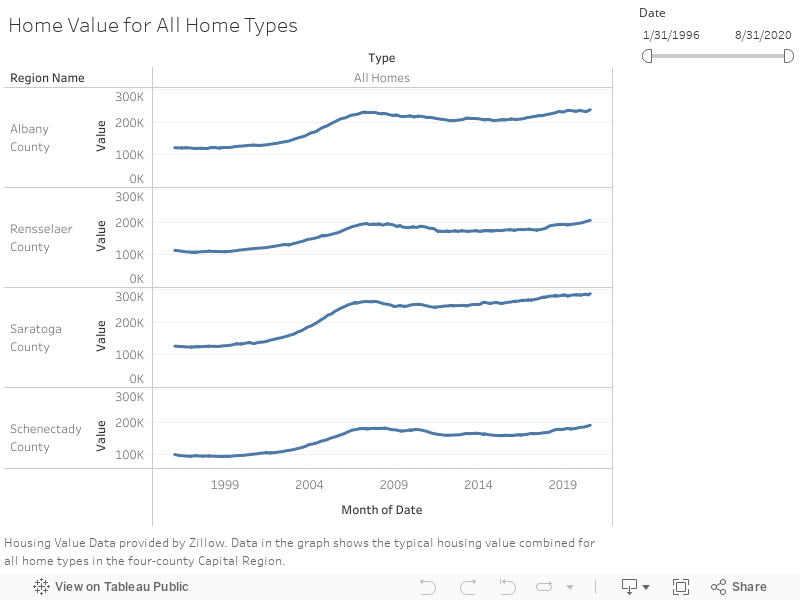
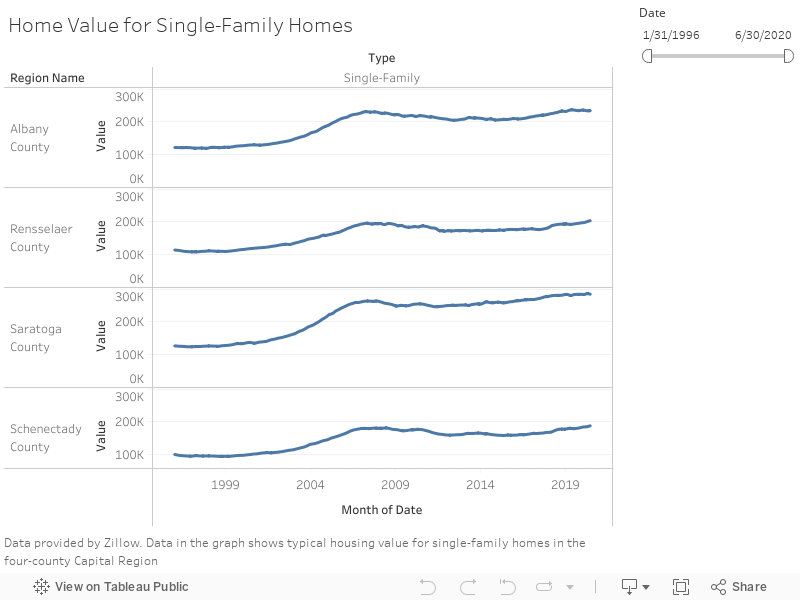
Housing
Housing data is a good indicator not only for the health of an economy, but for interest in an area as well. Higher rates of home ownership typically coincide with good economic conditions, and rising home sale prices in an area indicate a higher interest in moving into the area. CDRPC utilized data from Zillow for the average housing value, rent, as well as housing inventory and sales.
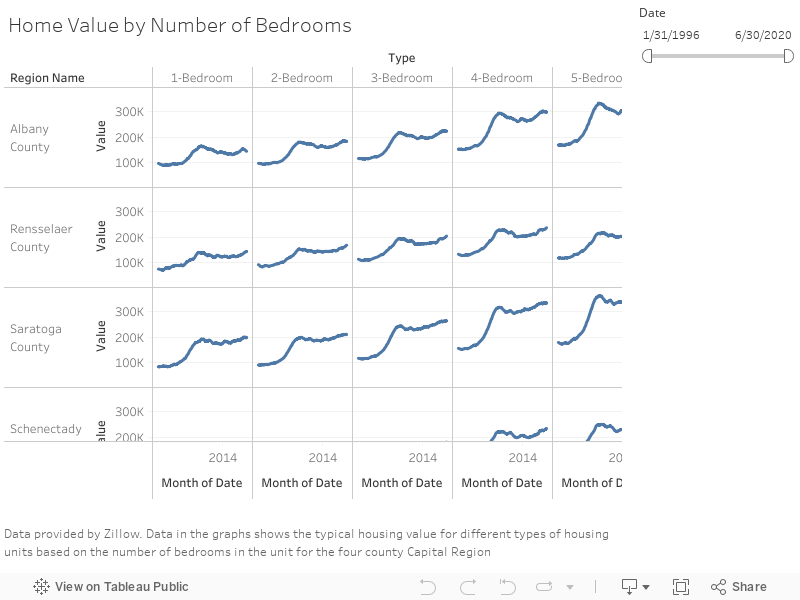
Home Values
Average home values for various housing types by county. Data is broken down by all home values, single-family homes, and housing units by number of bedrooms.
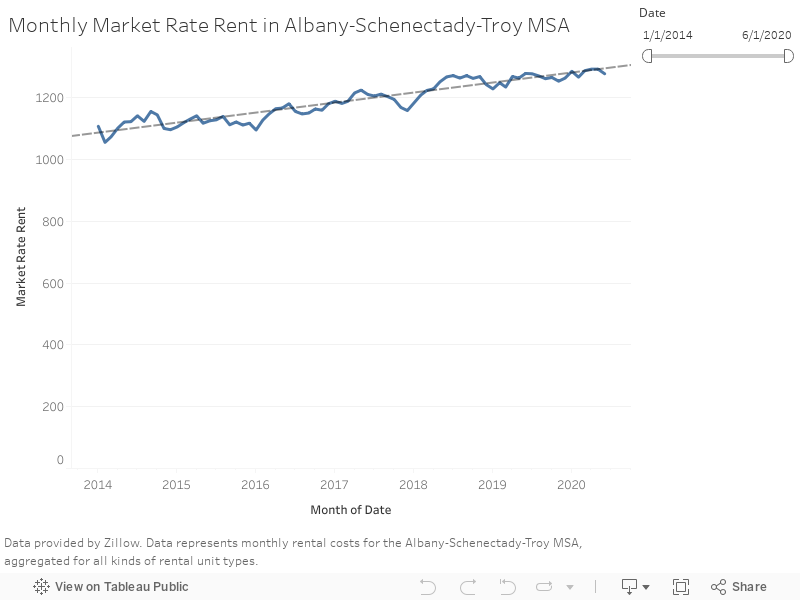
Monthly Rent
Monthly rate data represents the average market rate rent for all rental units in the Albany-Schenectady-Troy MSA.
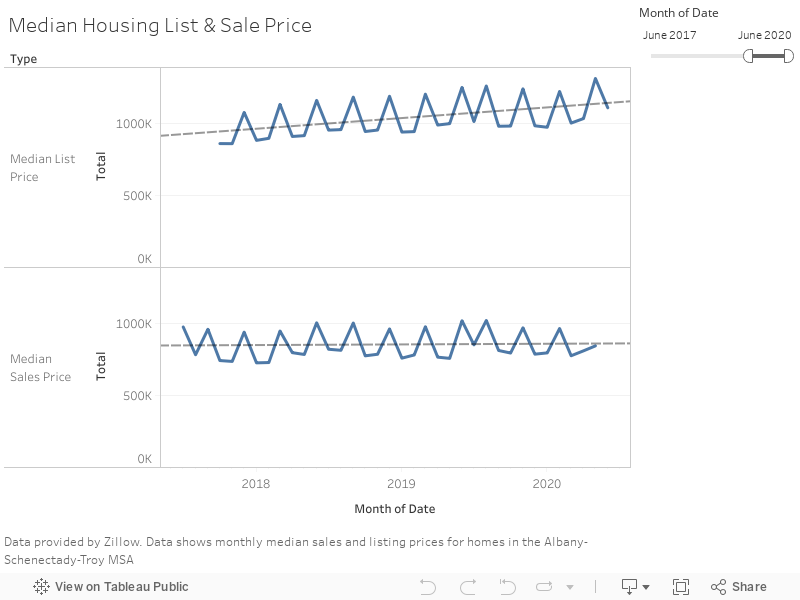
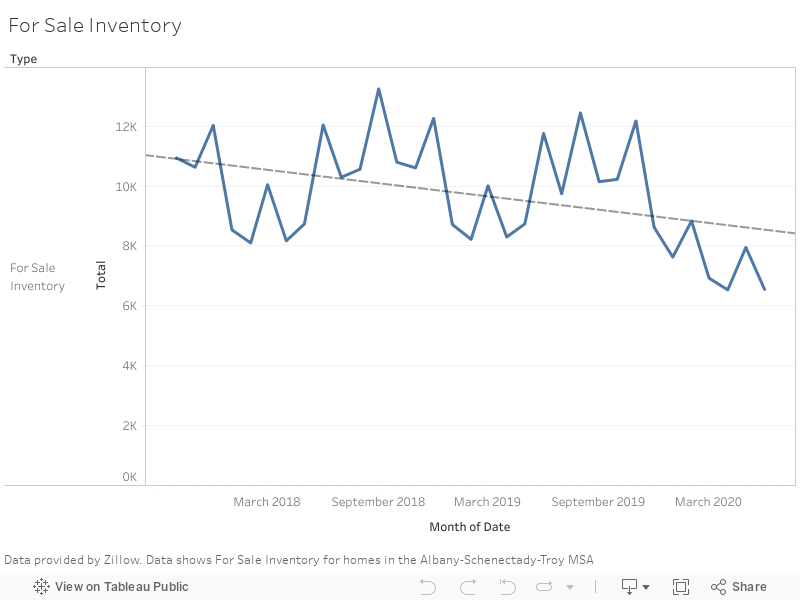
Inventory & Sales
Inventory data refers to the number of available housing units available for sale in the Albany-Schenectady-Troy MSA. Median List & Sale Price refers to the median value that homes are listed for sale at and the median price housing units are sold at.
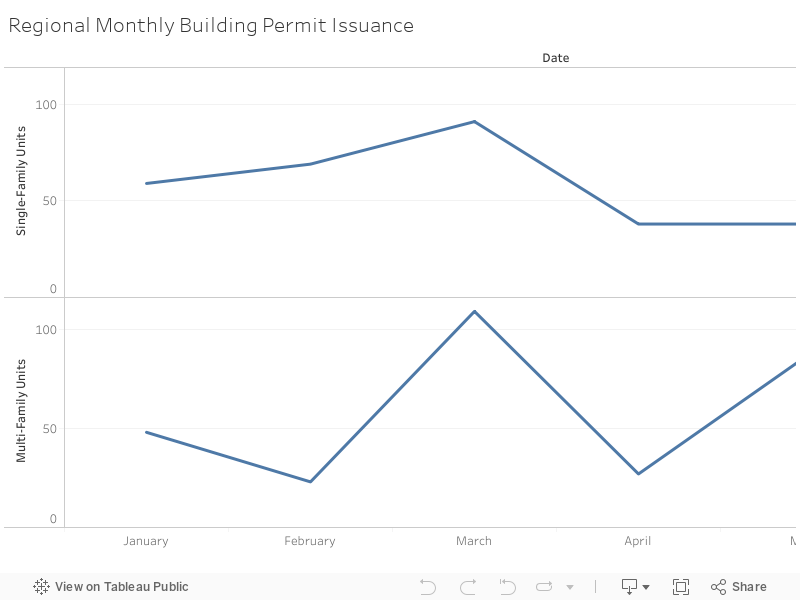
Monthly Building Permit Issuance
Monthly Building Permit Issuance tracks the total number of building permits issued across all of the municipalities in the four-county Capital Region area.
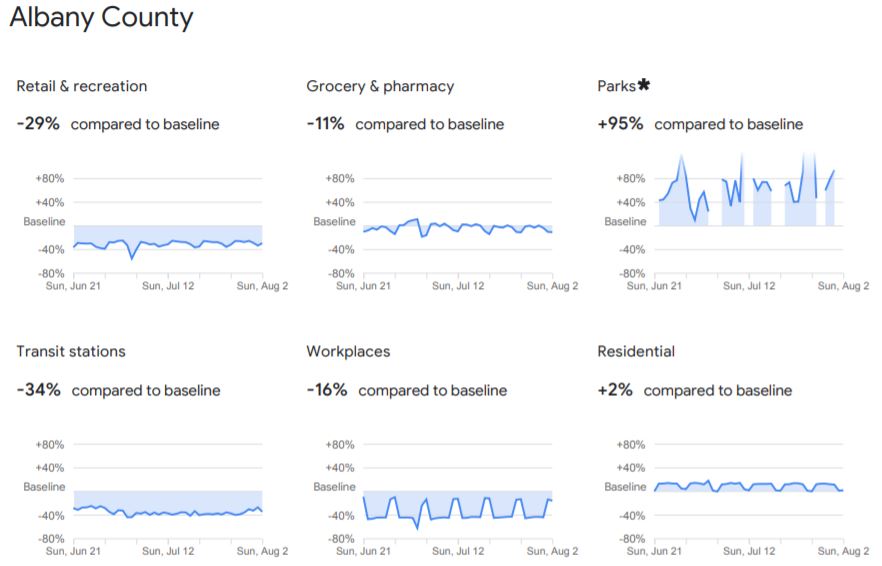
Mobility
Google Mobility Reports provide insight into how our movement and travel has changed since the start of the pandemic. The reports, broken down by county, show how travel to different types of areas has changed. Check out the reports here.
Capital Region Indicators
To learn more about the demographic, education, health, transportation, and other economic data in the region, check out Capital Region Indicators. This website provides a quick and easy way to learn more about all of the municipalities in the eight-county Capital Region area.