Population Estimates: Capital District Data for March/April
How has the population changed in the Capital Region? How do we measure up to the rest of Upstate New York?
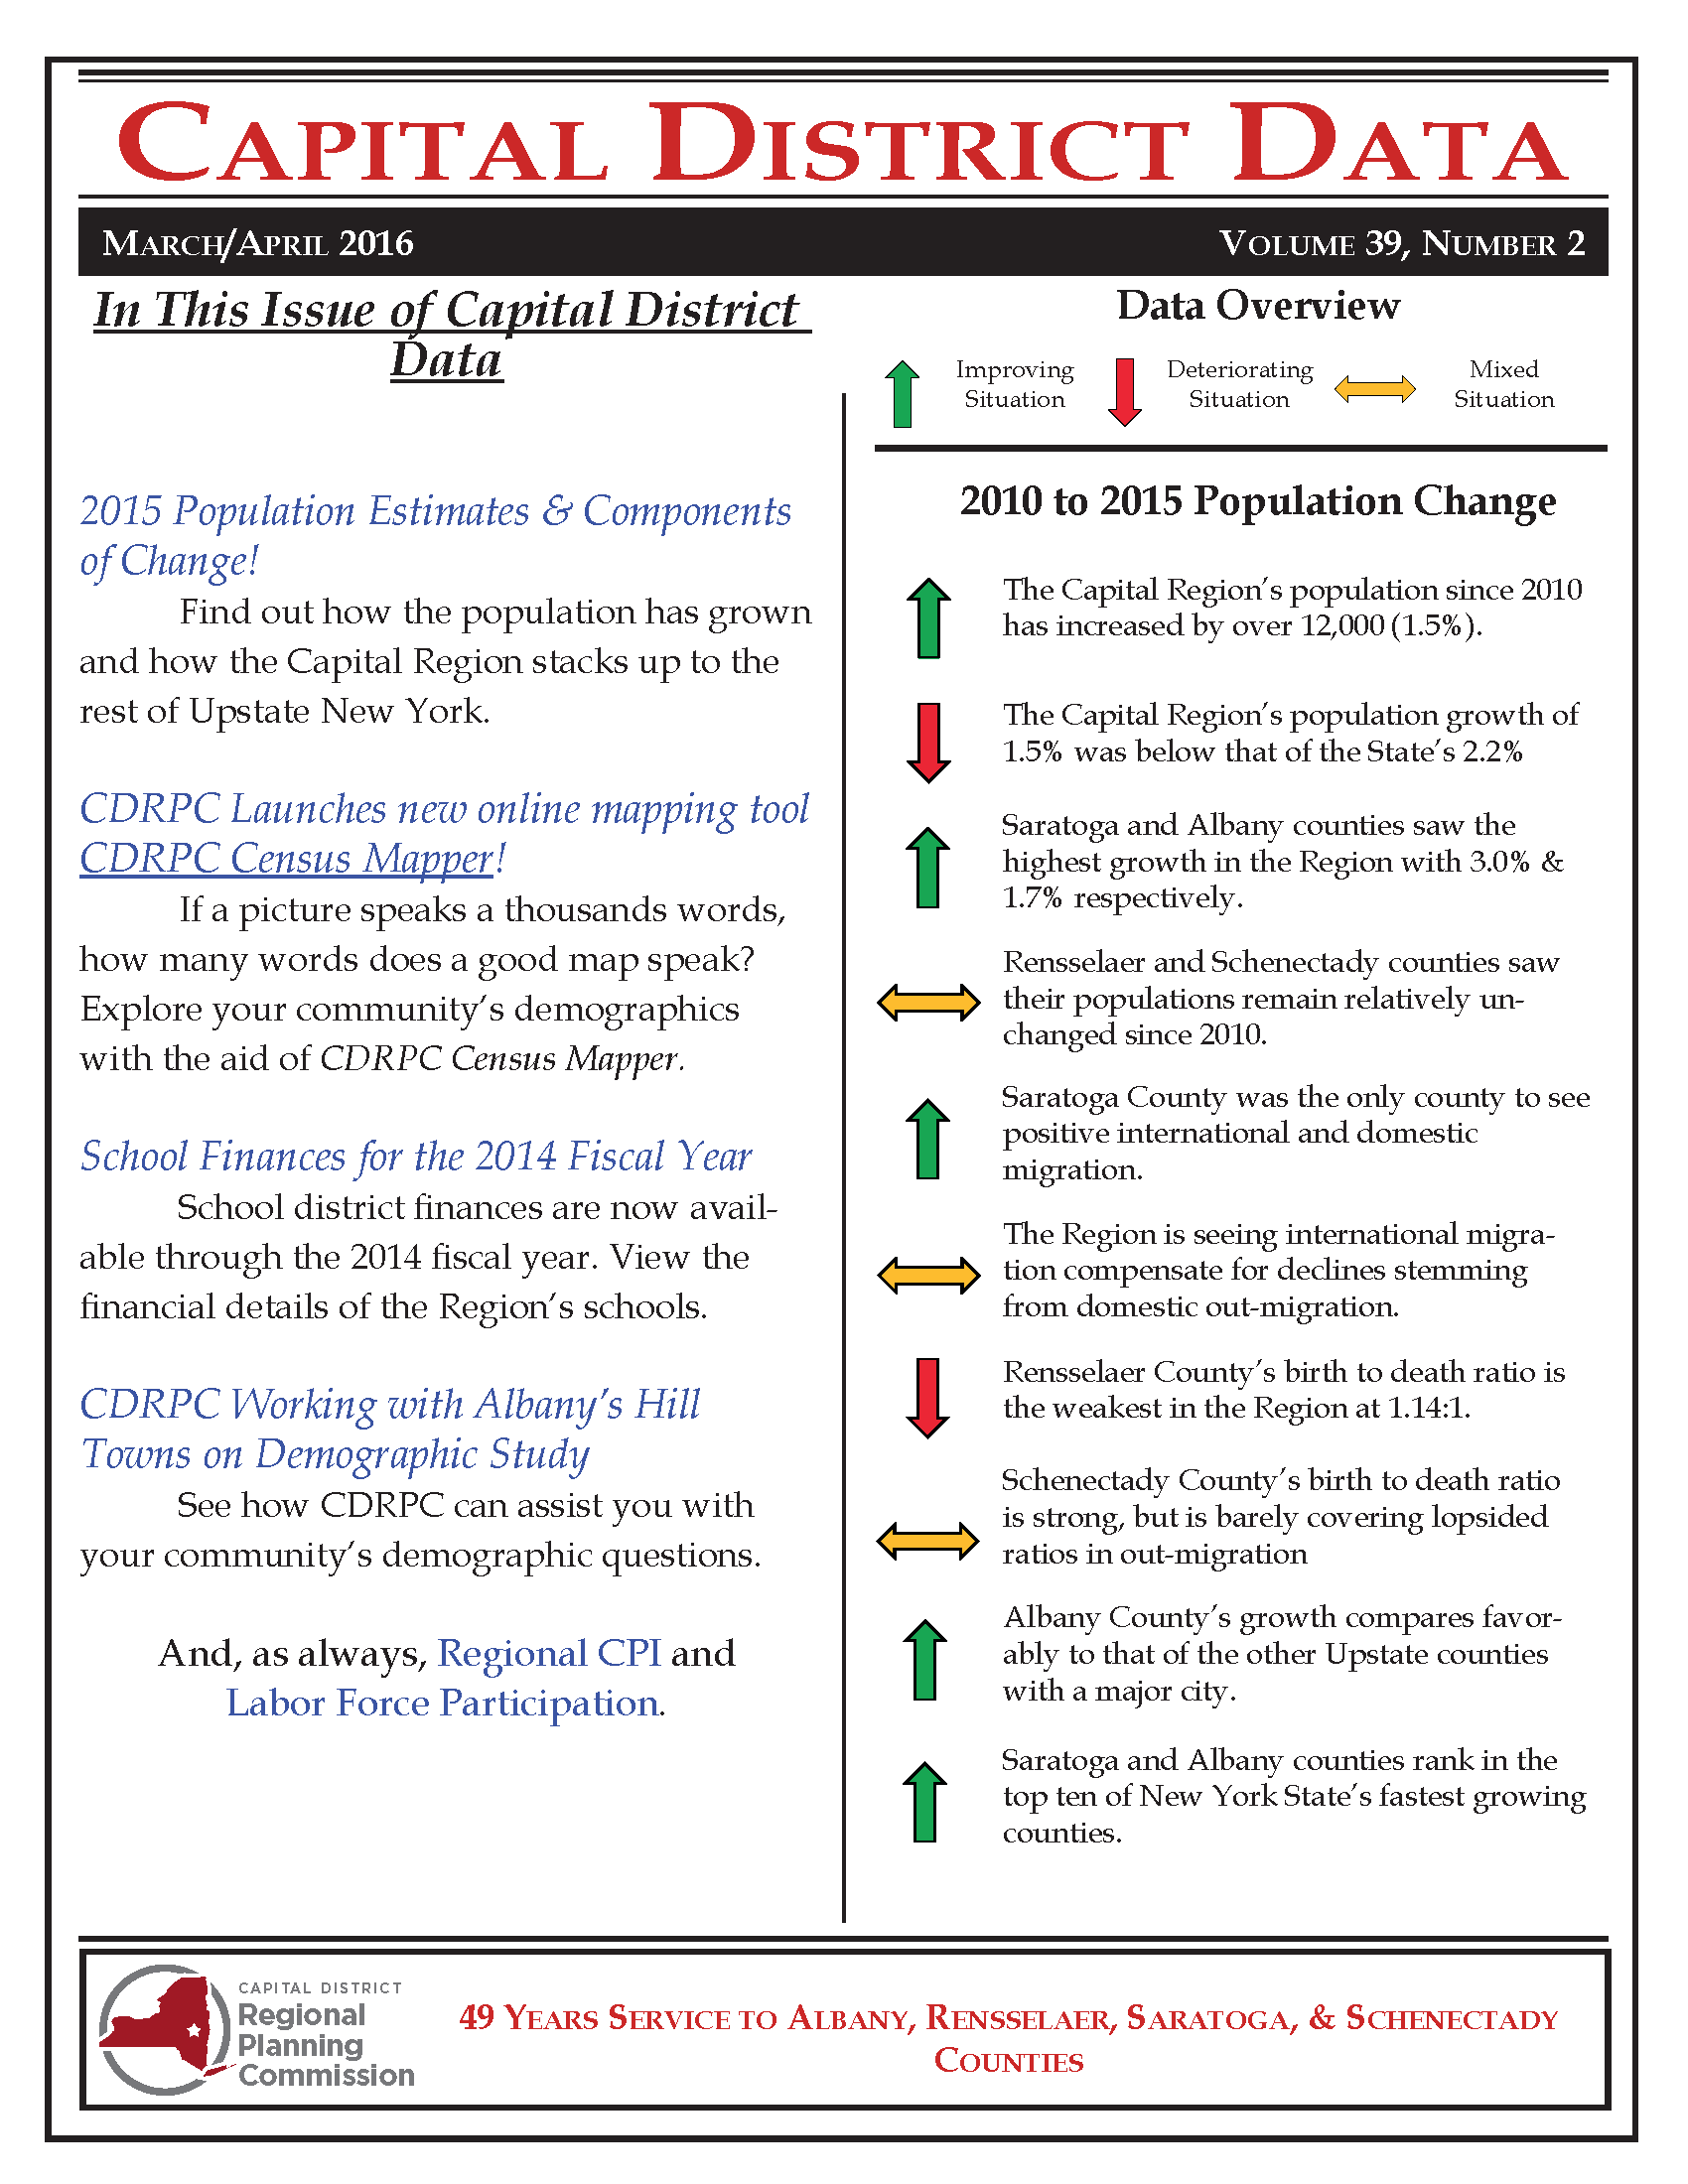 The March/April issue of Capital District Data is now available. In this issue, we examine how the region’s population has changed. For example, we’ve seen about a 1.5% increase in the overall regional population; Saratoga and Albany counties saw the highest growth while Rensselaer and Schenectady counties remained relatively flat.
CDRPC also introduces its new Census Mapper. This program is accessible through a web browser and allows the user to create customized thematic maps for the entire state Capital Region Economic Development Council region, (Albany, Columbia, Green, Rensselaer, Saratoga, Schenectady, Warren, and Washington, counties). CDRPC Census Mapper enables users to create individual thematic maps, compare side by side maps, contrast demographic change over time, determine the population within a defined radius, and much more.
School district finances are now available through the 2014 fiscal year. Local governments and school district are required to submit annual financial reports to the N.Y.S. Comptroller’s Office, which is also responsible for designing the report forms and the uniform system of accounts upon which they are
based. Periodic examinations of local government accounts are conducted by municipal examiners,
who not only check internal controls, State compliance, and financial reporting, but also assist
localities in improving financial management procedures.