Fewer and Smaller: The Decline of Farms in the Capital Region
The United States Department of Agriculture (USDA), through its National Agricultural Statistics Service (NASS), releases the Census of Agriculture every five years, in years ending in 2 and 7.
The practice of collecting information about farms and agriculture in the U.S. dates back to George Washington, who meticulously recorded data on his own farm, as well as neighboring farms. His observations covered a significant area, approximately 250 miles north to south and 100 miles east to west. These early efforts reflected the importance of agriculture to the country’s development and laid the groundwork for future agricultural data collection.
The first official Census of Agriculture was conducted in 1840, as part of the sixth decennial U.S. Census. At the time, agriculture was a cornerstone of the nation’s economy and growth, so gathering this data was seen as essential. However, it soon became clear that a ten-year interval between censuses was too long to adequately capture the rapidly changing nature of farming and agricultural practices. By 1920, the agricultural census was separated from the decennial population census, transitioning to a five-year cycle to provide more timely and accurate data on the agricultural sector’s dynamic shifts.
Today, agriculture remains a vital part of the U.S. economy, and the need for accurate, up-to-date data is essential to guiding policy decisions, supporting research and development, and ensuring that resources are allocated effectively to meet the needs of farmers and the broader agricultural sector. However, changes in the way data have been collected and categorized over the years have made it challenging to directly compare some statistics across different time periods. These adjustments, such as updates to the definitions of farms, shifts in survey methods, and the introduction of new data points, reflect the evolving nature of agriculture but can complicate long-term trend analysis.
The number of farms has decreased in the Capital Region
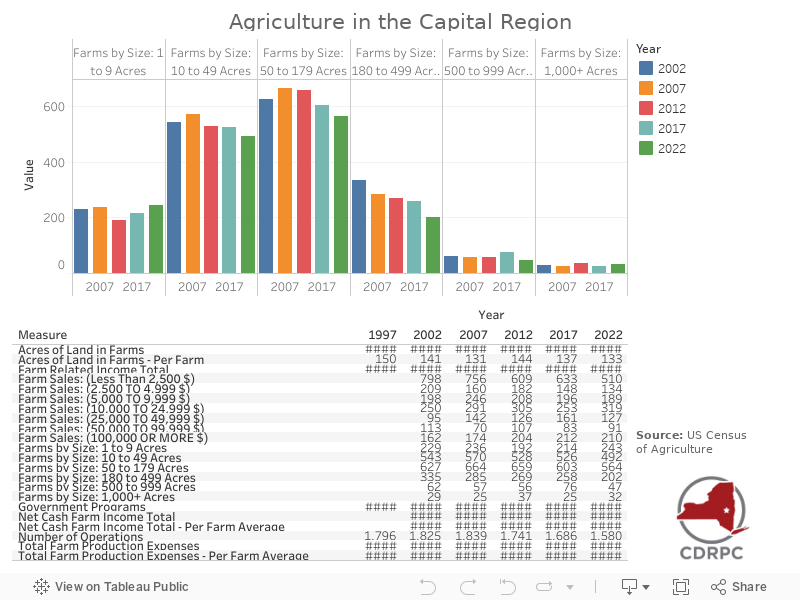
Over the past two decades, the Capital Region has experienced declines in its agricultural presence. Since 2002, the number of farms has dropped by 245, or 13.42%. This decline has been accompanied by a reduction of farmland acreage, which has shrunk from 258,110 acres in 2002 to 210,431 acres in 2022 which is a loss of 47,679 acres, or 18.47%.
In just the past five years, farmland acreage has declined from 1,686 acres to 1,580 acres which is a reduction of 9.0%. During this same period, the region lost 106 farms.
According to the 2022 Census of Agriculture, Saratoga County holds 38.23% of the total number of farms in the Capital Region, the largest share of all the counties.
This trend mirrors broader national patterns in agriculture. After peaking at 6.8 million farms in 1935, the number of U.S. farms fell sharply until the early 1970s, primarily due to increasing productivity and expanding non-farm employment opportunities. Since 1982, the decline has continued but at a slower pace.
Most farms in the Capital Region are between 50 and 179 acres
In the Capital Region, the majority of farms, 564 in total, fall within the 50-179 acre category, making it the most common farm size in the area. However, all other size categories from the 2017 to 2022 agricultural census have experienced declines. All categories except for farms over 1,000 acres, which have increased by 28% over the last 5 years.
Most farms in the Capital Region make less than $2,500 in farm related income
In the Capital Region, 32.3% of farms earn less than $2,500 annually in farm-related income. This substantial proportion underscores the prevalence of small-scale or part-time farming operations, where agriculture may not serve as the primary income source. The next largest category of income earners, representing 26.1% of farms, generates between $10,000 and $24,999 annually. This category also experienced the most growth over the past five years.
93% of farms in the Capital Region are family farms
In the Capital Region, an impressive 93% of farms are classified as family farms, reflecting the vital role that these operations play in local agriculture. Notably, Schenectady County stands out with 96% of its farms being family-owned, highlighting the strong tradition of family farming in the area. This is slightly below the New York State average, where 98% of farms are family-owned. The predominance of family-run operations underscores the essential contributions of individual farmers and their families to the agricultural landscape, reinforcing the notion that agriculture is not just an industry, but a way of life deeply rooted in the region’s history and .
18.9% of farms sell directly to customers
In the Capital Region, 18.9% of farms engage in direct sales to customers, through farmers markets, on-farm stores or stands, roadside stands or stores, pick-your-own operations, community supported agriculture (CSA) arrangements, or online marketplaces. By selling directly, these farms can provide fresh, locally sourced products while often receiving a higher return on their investments.
Direct food sales are particularly concentrated in certain regions of the U.S., with states like California leading the way, accounting for 37.7% of such sales, and a notable presence in the Northeast. Many counties with high volumes of direct sales are situated near metropolitan areas, where larger populations create significant customer bases for producers. This trend not only enhances local economies but also fosters closer relationships between farmers and consumers, promoting a greater understanding of sustainable agricultural practices.
8.4% of farmers are young farmers (35 years or younger), while 40.8% of farmers are 65+
In the Capital Region, the age distribution of farmers reveals a notable generational divide. As of 2022, only 8.4% of farmers are 35 years or younger, compared to 7.9% in 2017, marking a slight increase in younger farmers. In contrast, 40.8% of farmers are 65 years or older, up from 35.6% in 2017, reflecting a significant rise in older farmers.
This mirrors national trends, where the number of producers under 35 increased by just 3.9% from the previous census, while those aged 65 and older saw a 12% increase. These patterns raise concerns about the sustainability of family farms as older farmers approach retirement without a robust influx of younger farmers to take their place.
On a broader scale, younger farmers are more concentrated in Northern states, including New York, Pennsylvania, Ohio, and the Great Plains states. Counties with the highest proportion of young farmers tend to be in the Great Lakes, Northern Great Plains, and Northeast regions, while Southern regions like the Mississippi Delta and Southeast have the lowest shares of young producers.
Dairy farmers are decreasing rapidly
In the Capital Region, the number of dairy farm operations has dropped significantly, decreasing by 50% over the past five years. In 2017, there were 76 dairy farms, but by 2022, that number had fallen to just 38. This sharp decline mirrors a statewide trend in New York, where the number of dairy farms decreased by 81.83%, from 3,894 in 2017 to 2,191 in 2022. This downturn reflects widespread challenges within the dairy industry, such as fluctuating milk prices, rising operational costs, and increasing pressure to consolidate, all of which are making it harder for smaller dairy farms to stay afloat.
Farm income has increased in the last five years
Net farm income in the Capital Region has risen by 16.78% over the past five years (adjusted for inflation), reflecting a positive trend despite challenges in the agricultural sector. In 2022, net farm income in the region reached $51,097,000. Looking further back, since 1997, net farm income has increased by an impressive 122.37% (adjusted for inflation). Remarkably, net farm income has shown consistent growth in each agricultural census since 1997, highlighting the long-term strength and adaptability of farming in the region.
For detailed information on each of the Capital Region’s counties, you can explore the U.S. Census of Agriculture fact sheets provided below:
For more more information regarding data collection and data changes over time check out the resources below:
https://www.youtube.com/watch?v=ytUG-HWepkk
Helpful definitions for understanding this post:
Farm: Any place where $1,000 or more of agricultural products were produced or sold during the census year.
Farm-related income includes:
- Sales: The market value of agricultural products sold, including food marketing practices, landlord’s share, and value-added products
- Government payments: Payments from government farm programs
- Other income: Income from farm-related activities, such as machine hire, custom work, and commodity insurance indemnities
- Other sources: Income from grazing, royalties, leases, and recreational activities like hunting, fishing, and tourism
Producer: Any person or entity that operates a place which produced and sold, or would normally would have sold, $1,000 or more of agriculture products during the census year.
Family Farm: Any farm where the majority of the business is owned by the producer and individuals related to the producer.
Net farm income (NFI): Reflects income after expenses from production in the calendar year and is calculated by subtracting farm expenses from gross farm income. NFI considers cash, noncash income, and expenses and accounts for changes in commodity inventories.
Government payments: This category consists of payments from Conservation Reserve Program (CRP), Wetlands Reserve Program (WRP), Farmable Wetlands Program (FWP), and Conservation Reserve Enhancement Program (CREP); loan deficiency payments; disaster payments; other conservation programs; and all other Federal farm programs under which payments were made directly to farm producers, including those specified in the 2018 Agricultural Act (Farm Bill), including Agriculture Risk Coverage (ARC) and Price Loss Coverage (PLC). Commodity Credit Corporation (CCC) proceeds, amount from State and local government agricultural program payments, and Federal crop insurance payments were not tabulated in this category.