Cost of Living Q4 Update
The Cost of Living Index (COLI) measures relative price levels for consumer goods and services in participating areas. The average for all participating places, both metropolitan and nonmetropolitan equals 100 and each participant’s index is read as a percentage of the average for all places. It is important to note that the COLI Index is not a good indicator of inflation or deflation since the index is a relative measure. For a more accurate representation for inflation see CDRPC’s Consumer Price Index (CPI) and Producer Price Index (PPI) Index.
Since CDRPC’s last COLI update in Quarter 2 (Q2) of 2022, the cost of living index in the region has fluctuated in all categories. From Q2 to Q3 there were decreases in the Utility, Transportation, Health Care, and Grocery Items categories. While there were increases from Q2 to Q3 in the Misc. Goods and Services, Housing, and the Composite Index categories. From Q3 to Q4 there were increases in all categories besides Housing.
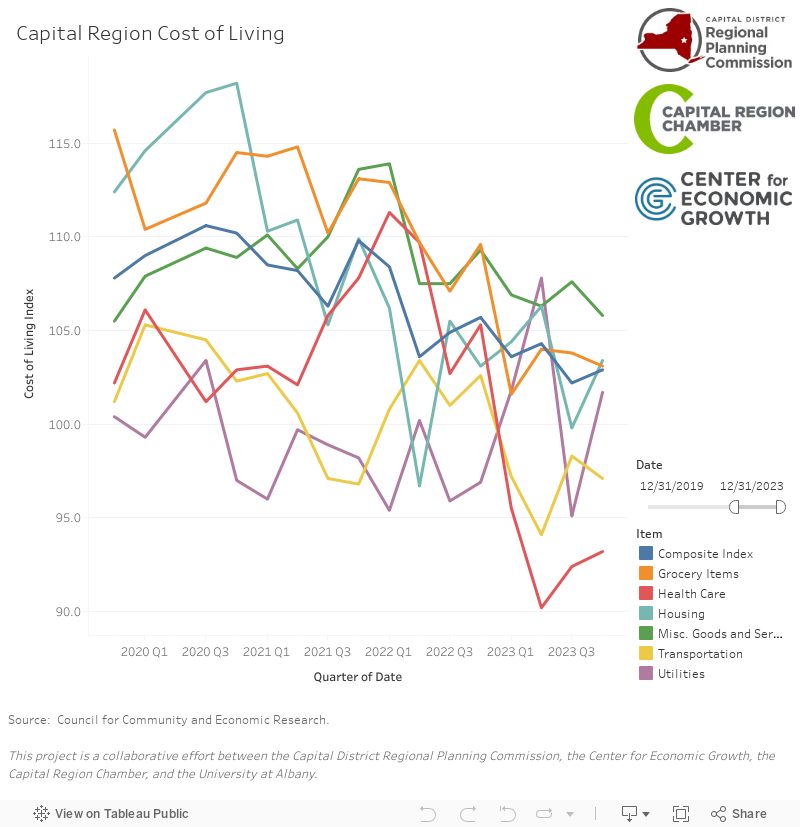
In Q4, the Cost of Living Index in the Capital Region compared to the national average is:
- 1% less than the national average for Utilities.
- 6% more than the national average for Transportation.
- 1% more than the national average for Housing.
- 3% more than the national average for Health Care.
- 7% more than the national average for Composite Index.
- 3% more than the national average for Misc. Goods.
- 6% more than the national average for Grocery Items.
From Q3 to Q4 the index cost in the Capital Region changed as followed:
- Utilities increased by 1.0%
- Transportation increased by 1.6%
- Housing decreased by 2.3%
- Health Care increased by 2.5%
- Composite Goods increased by 0.76%
- Grocery Items increased by 2.3%
According to the COLI year-end review here are the top 10 most expensive and least expensive locations to live in the United States. Not surprisingly, Manhattan’s cost of living is more than twice than the national average, while Harlingen, Texas has a cost of living that is more than 25% lower than the national average.

Source: The Council For Community and Economic Research (C2ER)
Comparison to Peer Communities
One of the benefits of using the COLI index is that it makes it possible to compare changes across the country. CDRPC determined peer communities in the 2015 Capital Region Indicators Report. These communities were selected on the criteria that they are within 40% of the Albany-Troy-Schenectady MSA or if they contain a state capital.
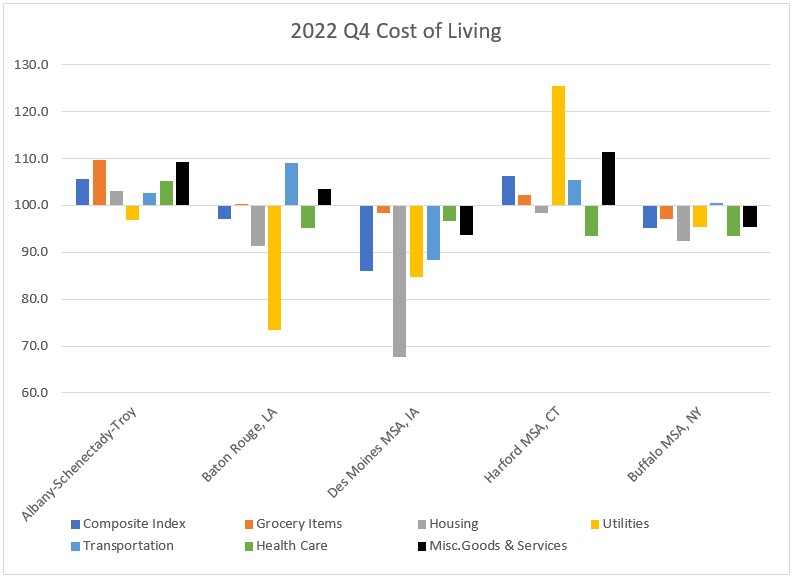
Majority of selected peer communities saw below the average index for most categories in Q4, with the lowest indices in Des Moines, IA. Hartford, CT and Albany-Schenectady-Troy saw higher values than the national average in most categories. Only differing by 0.5% in the composite category.
The major differences between Albany and Hartford is that Albany had an index below the national average for Utilities while Harford had well above the national average for Utilities. Additionally, Harford had below average indices for Health Care and Housing in Q4, whereas Albany had above average indices.