2020 Total Population, Race, and Ethnicity Changes by Census Tract and County
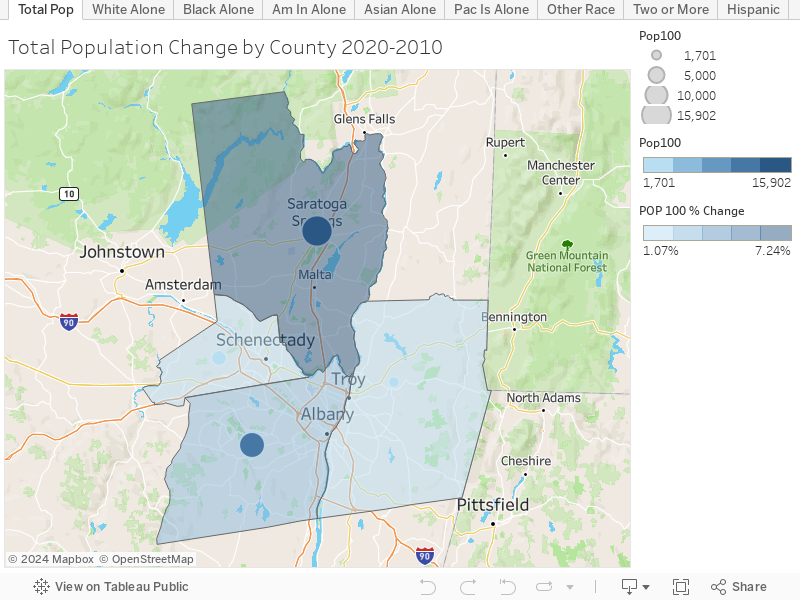
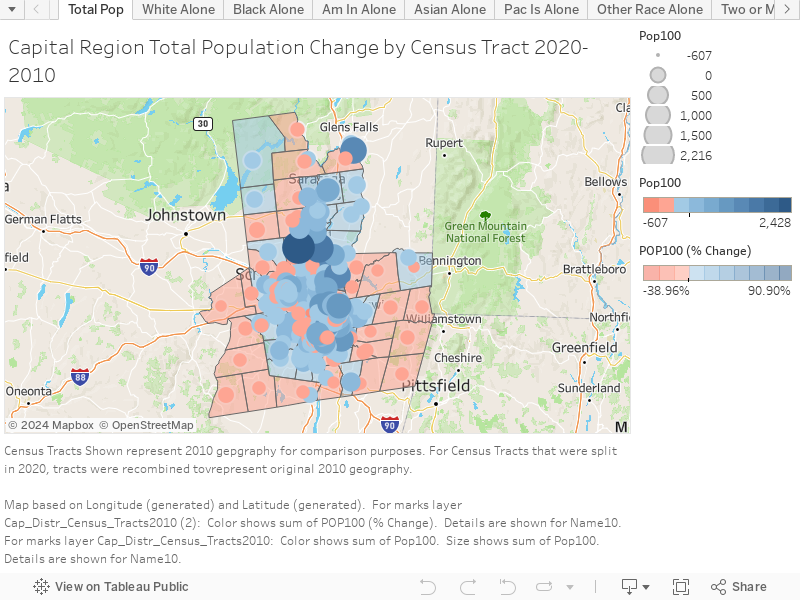
CDRPC has created maps for the county and census tract level which show both total and percent change for total population, race, and ethnicity. These maps show how the population of the region has changed from 2020-2010. Overall, the region saw a trend of population decrease in the rural areas, and population increases in the more urban areas and cities. The region has also seen a decrease in the number of residents who identify as White Alone, and a general increase in all other single race classifications as well as the number of residents who identify as two or more races.
The following maps show population changes at the county level and census tract level for the entire region. You can check out different data topics by switching the tab at the top of the map. The data topics include Total Population change, White Alone change, Black Alone change, American Indian Alone change, Asian Alone change, Pacific Islander Alone change, Other Race Alone change, Two or More Races change, and Hispanic change. CDRPC also has maps at the census tract level for each individual county.
Population Change by County 2020-2010
Capital Region Population Change by Census Tract 2020-2010
For more analysis and updates on the 2020 Census, check out CDRPC’s 2020 Census page here!