GHG Inventory
Capital Region Greenhouse Gas Inventory
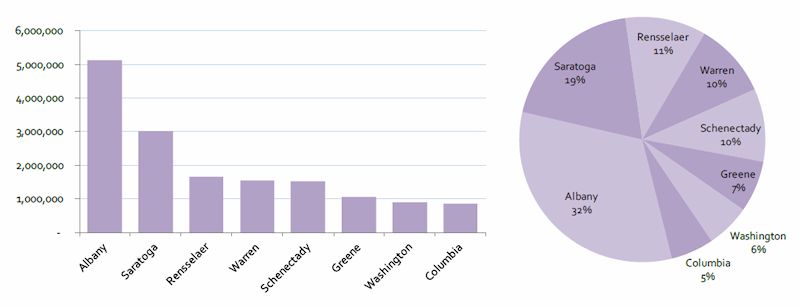
As part of the NYSERDA-funded Climate Smart Communities Regional Coordinators Pilot Program CDRPC and its consultant Climate Action Associates developed a Greenhouse Gas (GHG) Emissions Inventory of the Region. The inventory computes regional direct and indirect emissions and apportions them to all 160 cities, towns, villages, and the 8 counties in the capital region REDC.
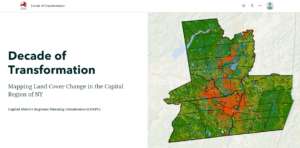
2010 Greenhouse Gas (GHG) Inventory Dashboard
The CDRPC has created a GHG inventory dashboard that updates the 2010 data to provide easily accessible detailed information on the region’s communities.
Capital District 2010 Regional Greenhouse Gas Inventory by CDRPC
Highlights from the GHG Inventory
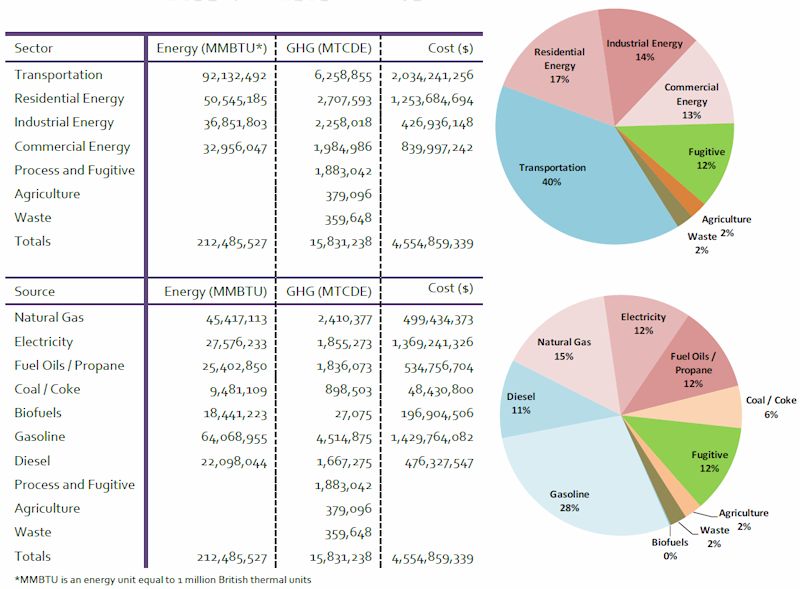
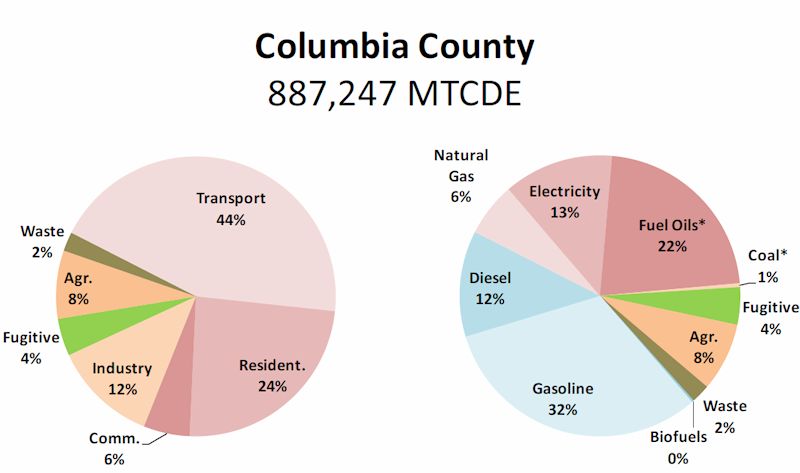
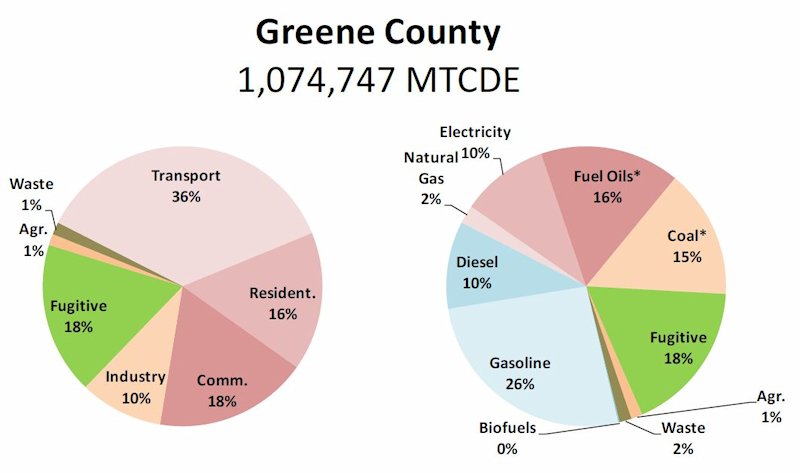
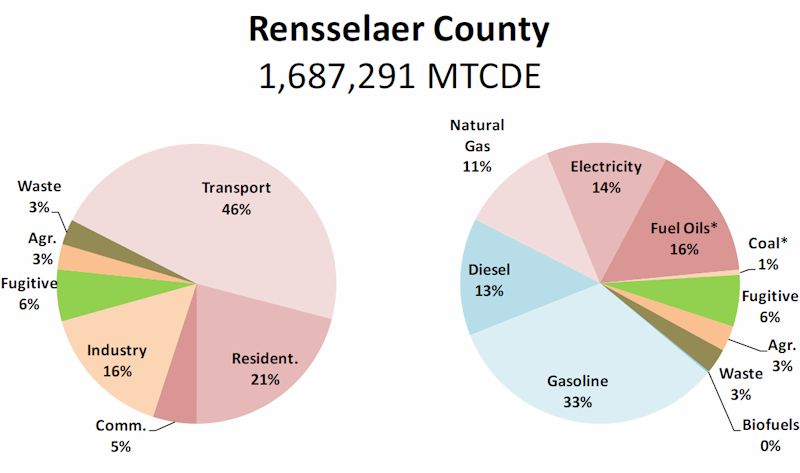
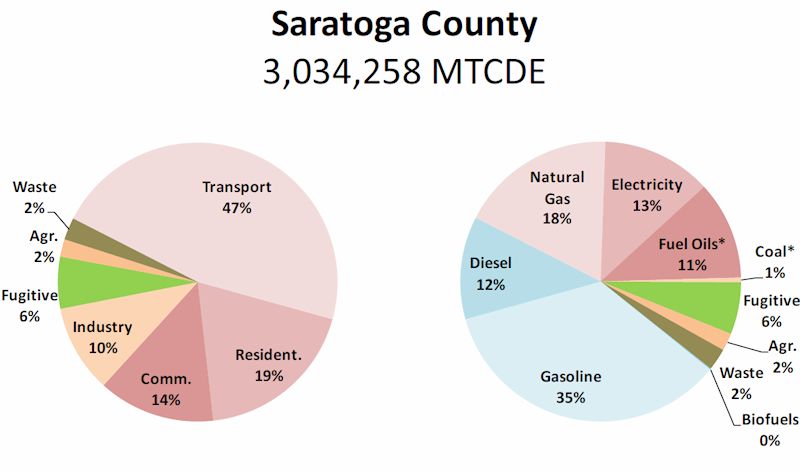
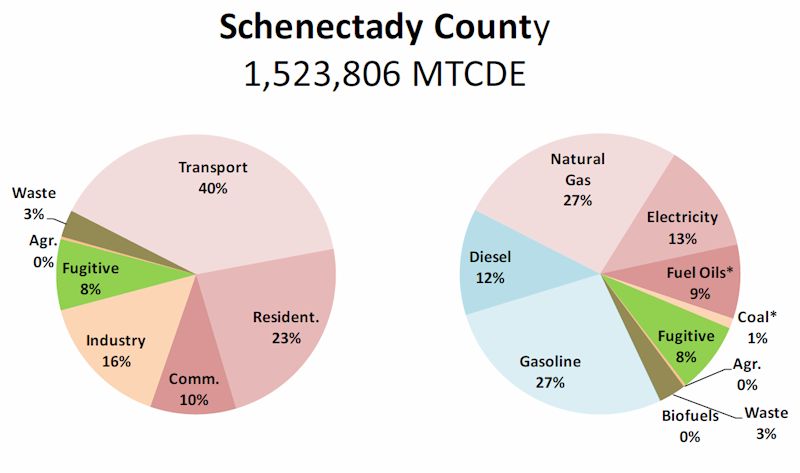
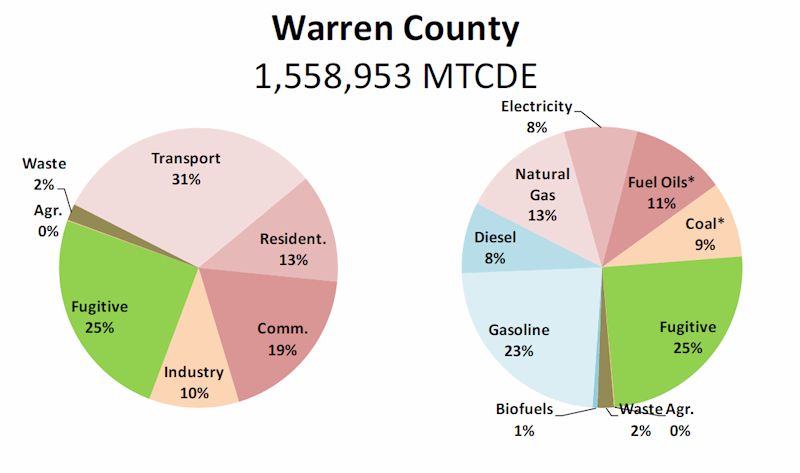
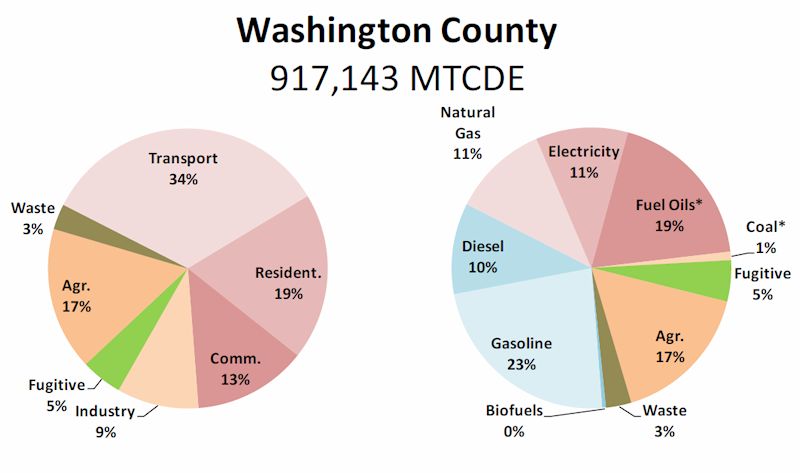
In 2010, the Capital District emitted 15,831,238 Metric Tons Carbon Dioxide Equivalent (MTCDE) greenhouse gas (GHG) emissions. Transportation fuels accounts for 40%, followed by energy consumption in the residential (17%), commercial (14%), and industrial (15%) sectors. Fugitive emissions contribute 12%, defined in the figures as the sum of industrial process, product use, and transmission/distribution loss emissions. Agriculture and waste sectors are the smallest contributing 2% each.
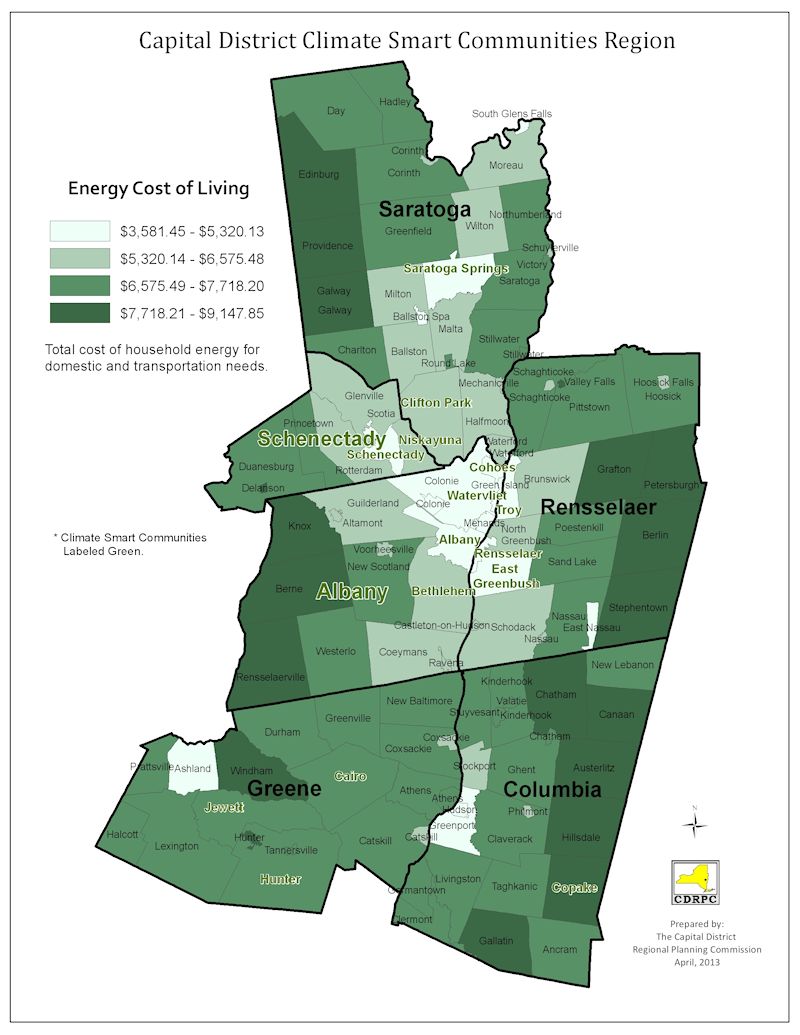
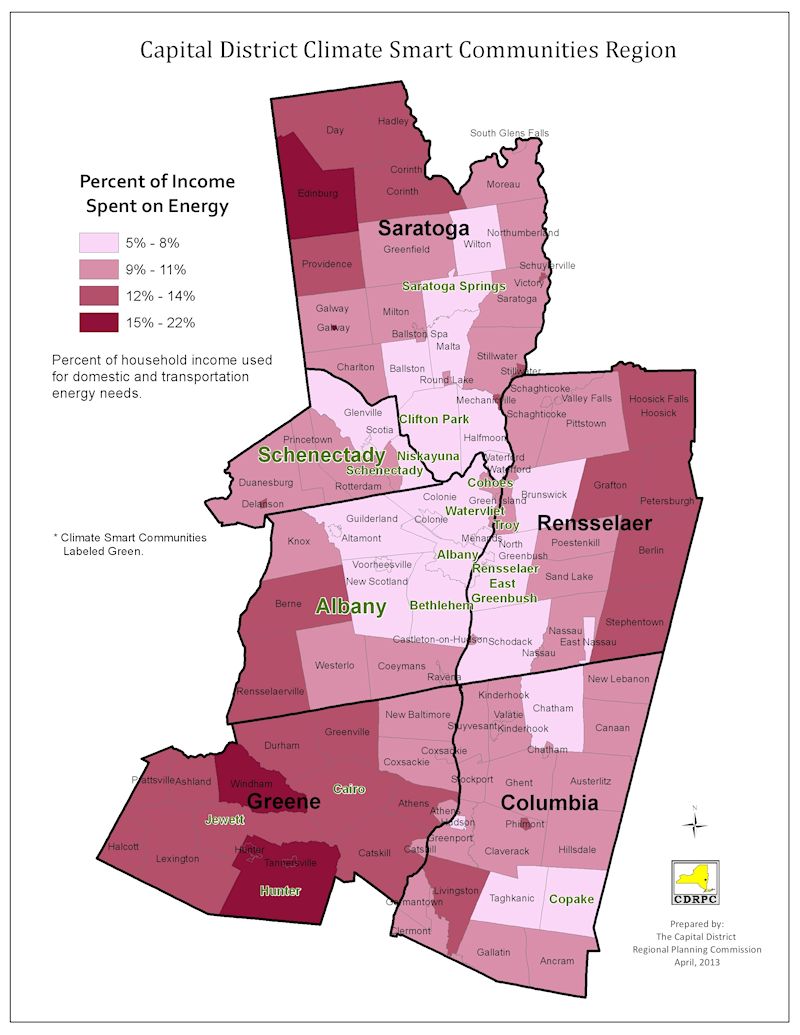
Across all forms, Capital District residents and business in 2010 spent $4.5 billion on energy of which two thirds ($2.9 billion) was on petroleum-based gasoline, diesel, and fuel oils. The cost of these fuels rose more than others and today the region pays $1.75 billion more per year for petroleum fuels than it did 10 years ago-that’s a rise of $1600 per person (adjusted for inflation). Rural areas with lower incomes and those dependent upon fuel oil have been hit the hardest.
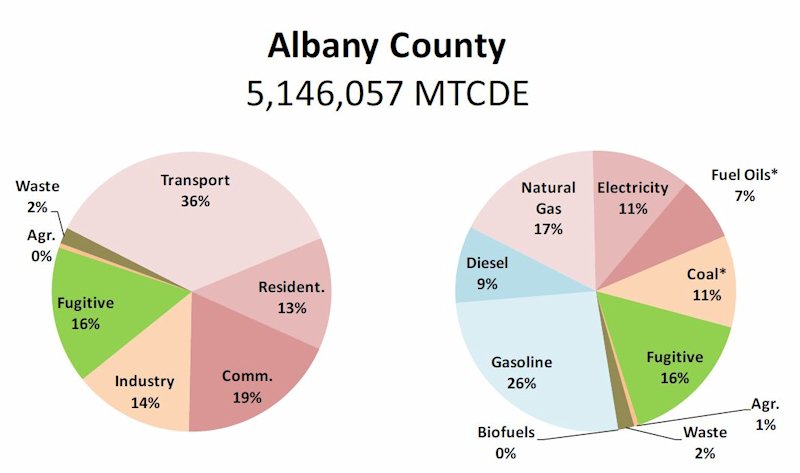
Transportation fuels dominate in all counties and account for 40% of the Capital District’s GHG emissions. Significant reductions and cost savings may be possible by introducing electric vehicles, alternative fuels, more efficient vehicles, transit, and more walkable, compact development patterns. This is particularly so because Upstate New York’s electricity is the least-carbon intensive in the nation and therefore offers a unique opportunity to reduce emissions and save residents money by electrifying on-road transportation. Shifting 20% of on-road gasoline vehicles to electricity would reduce Capital District emissions by 4.5% and save drivers $174 million in fuel costs.
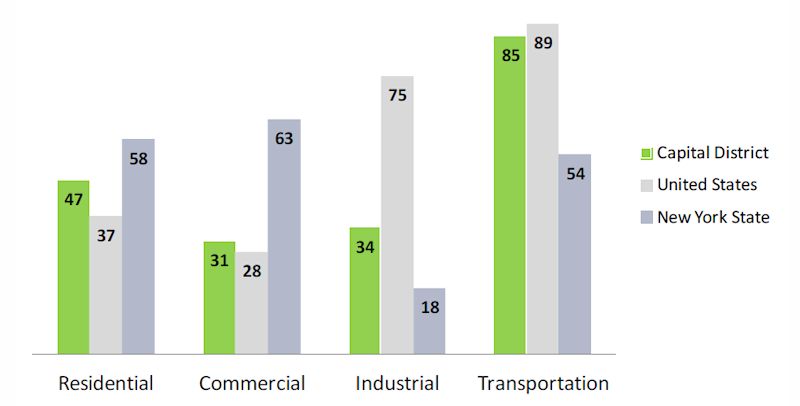
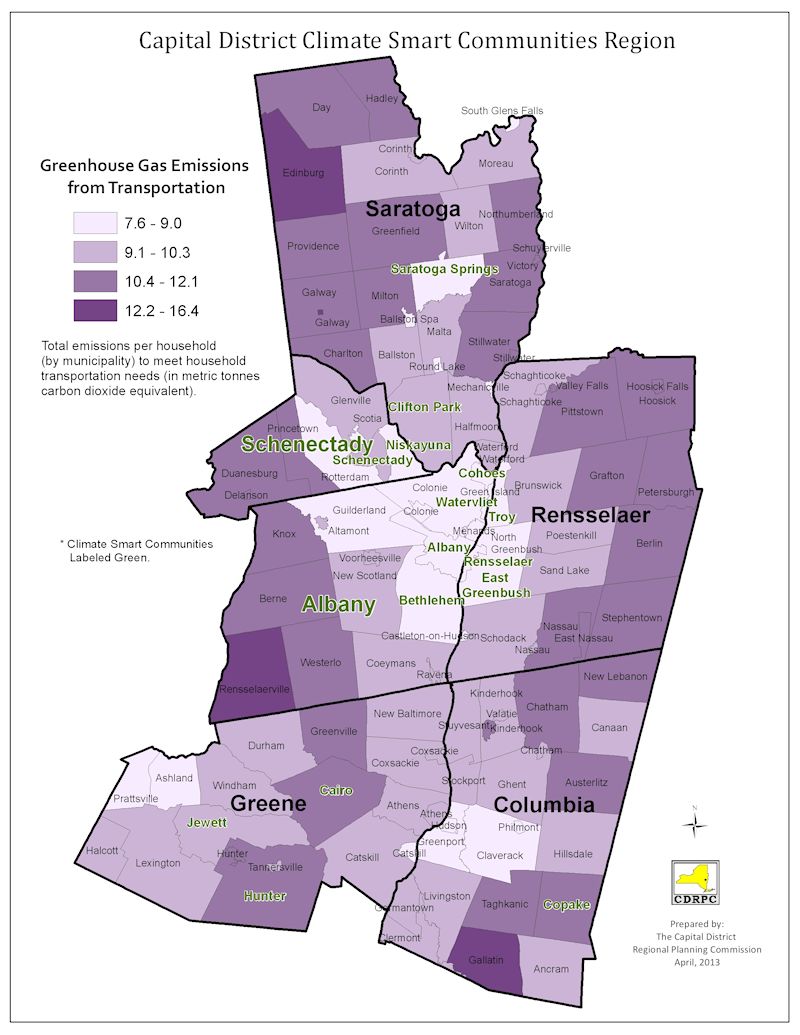
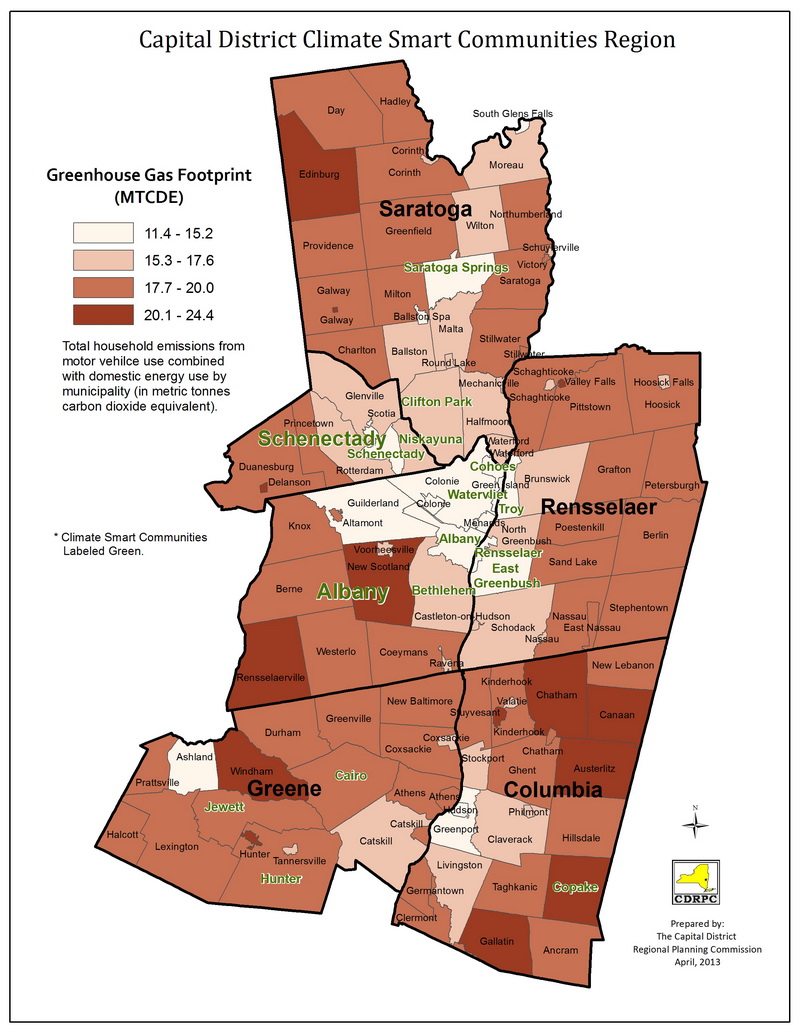
Development patterns in the Capital District influence emissions. Households in compact, employment-accessible areas generate 31% less greenhouse gas emissions and have 39% lower energy costs. Households in some rural towns consume three times more energy than households in some cities. Rising energy prices hit rural areas harder because they have longer commute distances (using gasoline) and rely on fuel oil and propane for heating. Households in some rural communities now spend 15-18% of total income on energy compared to those in urban communities that spend as little as 5-7%.

