 Capital District Population Projections Table
 CDRPC has completed revising its population and household projections for each of the Region's municipalities in ten-year increments to the year 2050.
As the Economic Development District for the four-county Region, CDRPC requires population and household projections to fulfill its demographic and economic planning functions. Other public and private organizations may find the projections of value in planning for the diverse needs of the Region's population in the new century. Practical uses might include developing economic strategies, designing service delivery programs, evaluating future housing needs, and preparing marketing and business plans.
The Population Projection Model implemented involved two distinct stages: a quantitative first stage using a log-linear regression projection model on historic Census data, and a qualitative second stage using non-quantitative judgments of the likelihood and extent of future population change within particular jurisdictions.
The Log-Linear model - so-called because of its straight-line form when plotted on graph paper which has a logarithmic scale for X-axis measurements - uses historic population to forecast or project future population based on a logarithmic curve, which is the best general model for natural populations.
Log-Linear models when used for forecasts will project the historic rate of change of the actual data into the future at a steadily declining rate (i.e., historic growth or decline will continue, but at a lesser rate). Log-linear models are an excellent basis for population forecasts because they project average historic rates of change into the future in a manner consistent with the average changes in natural populations. While short-term population data will often exhibit some variety of sawtooth pattern when charted, long-term population data usually follow a log-linear trend.
Historic data by minor civil division for the Region were fitted to individual log-linear models, and the results proportionally reduced or increased to force the sum of a county's MCDs to equal the county total.
The projections derived from the Log-Linear Model provided a basis from which to further analyze the forces which affect population change in each minor civil division. There are many historic trends other than simple population which may give an indication of the direction and extent of future population change, including, but not limited to, average persons per household, persons in group quarters, building permit issuances, new home and apartment unit construction, immigration and emigration patterns, journey-to-work data, and labor force data. In addition, there may be new development opportunities or constraints for particular jurisdictions embodied in Zoning and Sub-Division regulations, environmental regulations, economic development programs, and capital budgets for transportation facilities and water and sewer service extensions, to mention just a few of the possible sources. As much of this information as possible was considered in reviewing the projections which were derived from the Log-Linear Model for each jurisdiction, and changes made as appropriate.
The current set of projections also incorporate modifications to the original projections in light of subsequent analysis and projections of the age cohorts.
Capital District Population Projections Table
Capital District Group Quarters Population Projections Table
Capital District Population in Households Projections Table
Capital District Household Projections Table
Capital District Persons Per Household Projections Table
Each map will open in a new window to facilitate comparisons.
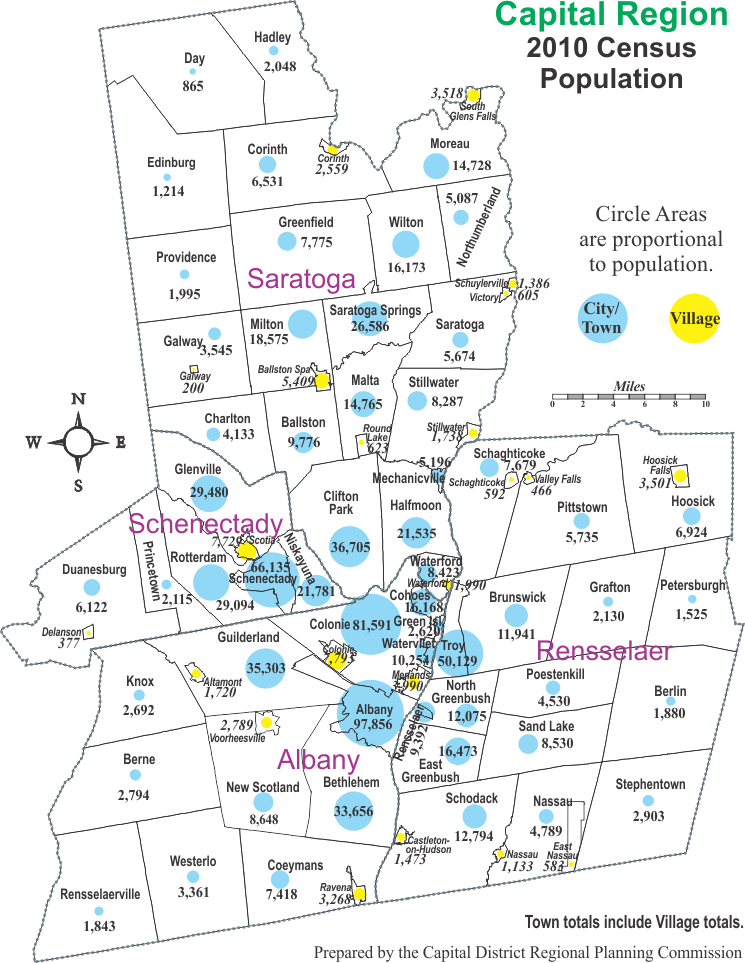 Capital District 2010 Census Populations
 Capital District 2020 Population Projections
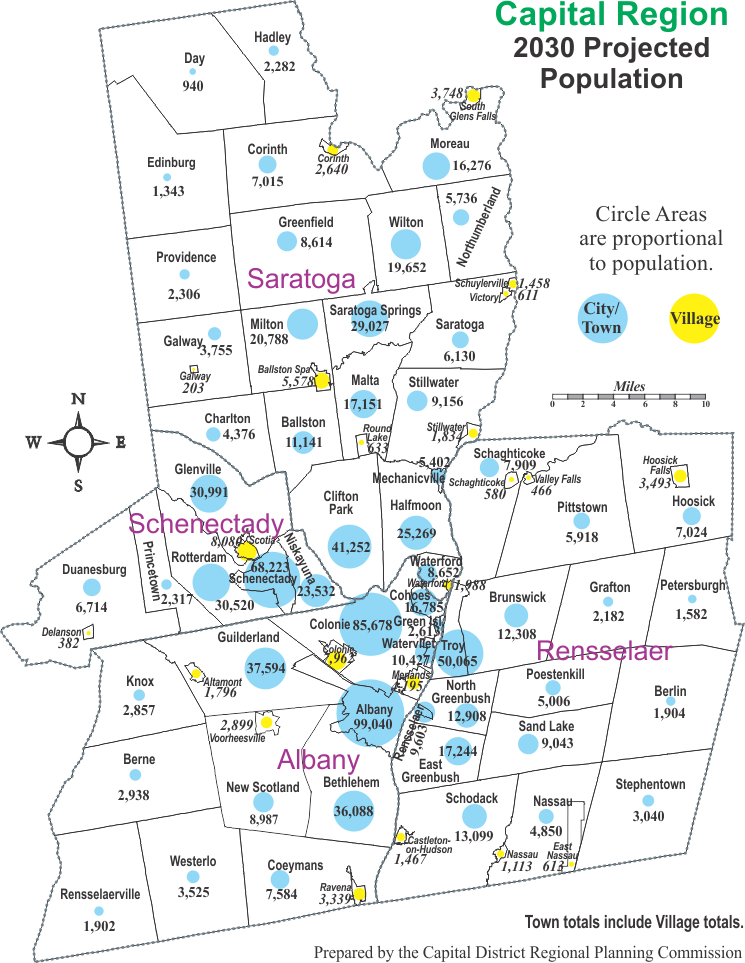 Capital District 2030 Population Projections
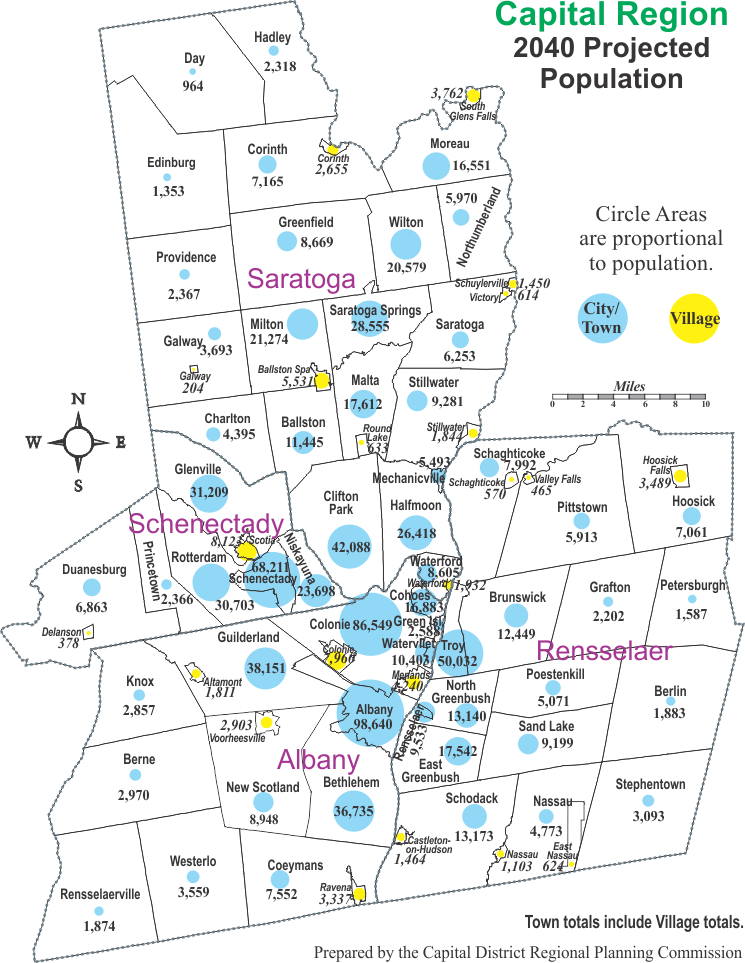 Capital District 2040 Population Projections
 Capital District 2050 Population Projections
 Capital District Projected Population Changes: 2010-2020
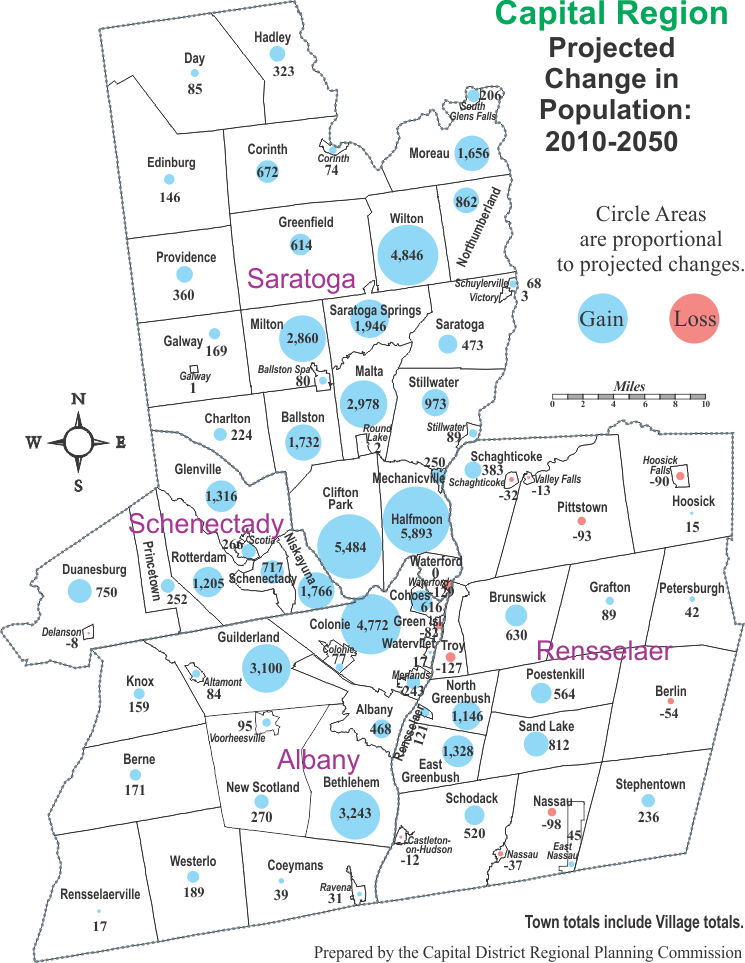 Capital District Projected Population Changes: 2010-2050
 Capital District 2010 Census Households
 Capital District 2020 Households Projections
 Capital District 2030 Households Projections
 Capital District 2040 Households Projections
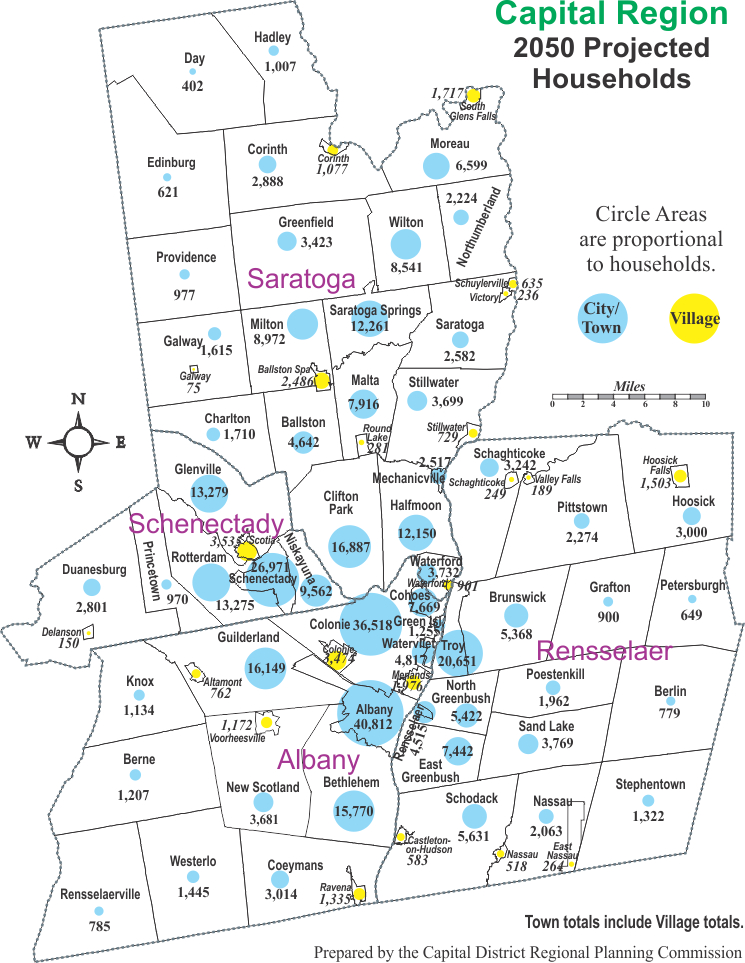 Capital District 2050 Households Projections
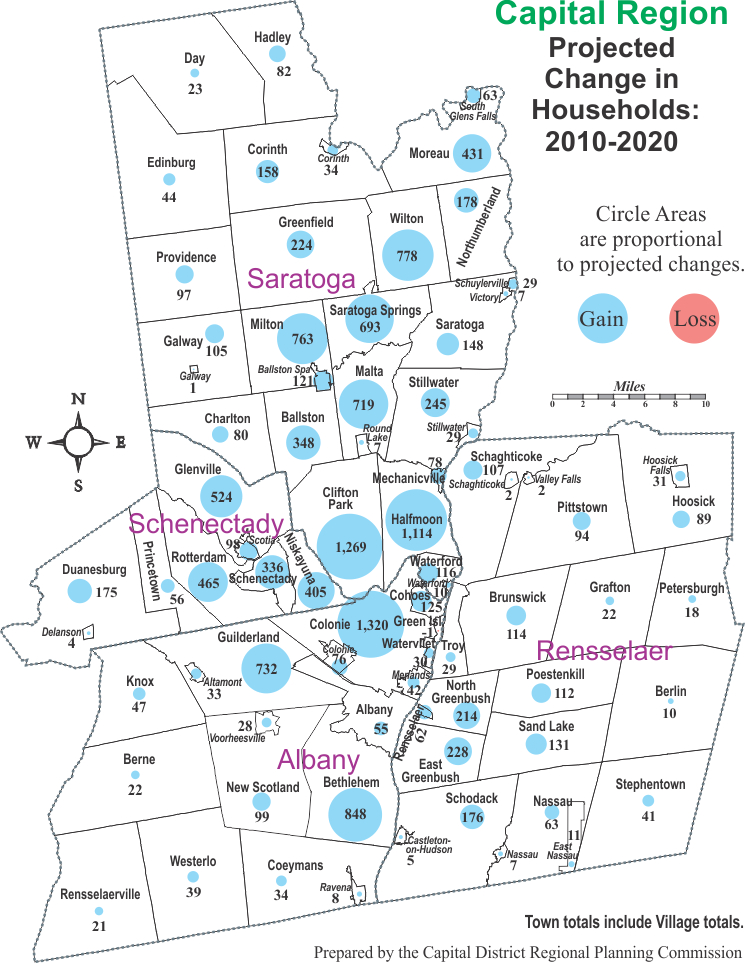 Capital District Projected Household Changes: 2010-2020
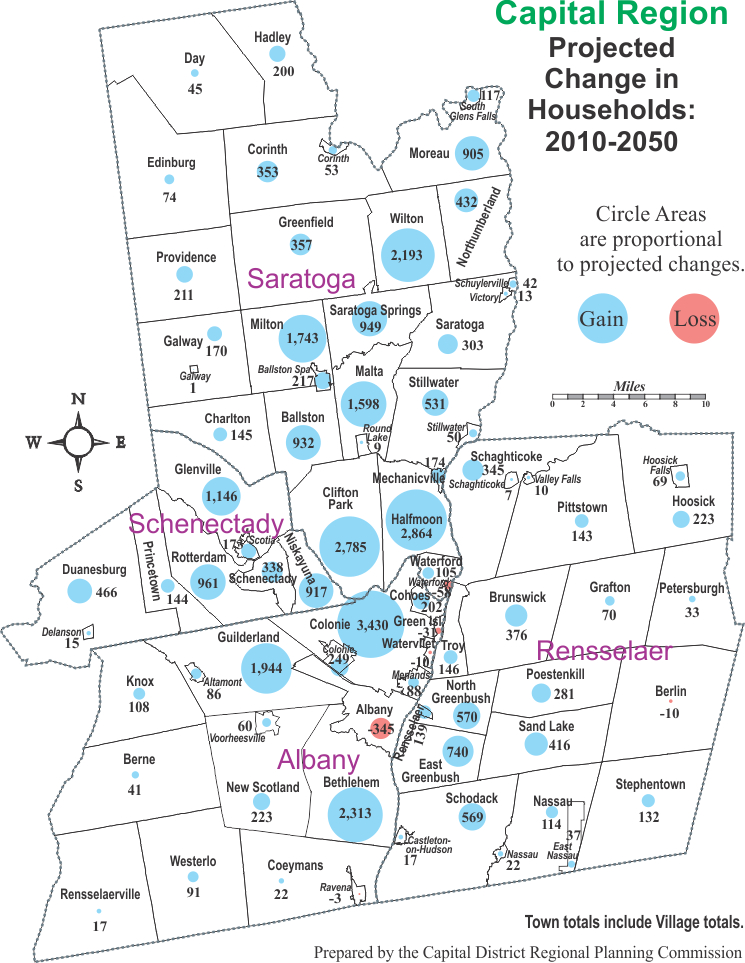 Capital District Projected Household Changes: 2010-2050
 Return to CDRPC Home Page